TL;DR:
- UK independent restaurants face tight profit margins due to rising costs.
- A structured expenditure analysis helps benchmark costs, identify issues, and improve financial control.
- Automated tools and weekly tracking are essential for effective cost management and quick response.
Margins at UK independent restaurants have never been tighter. Food inflation, rising National Living Wage rates, and energy costs have squeezed what little buffer most operators had left. Yet many owners still rely on gut instinct or end-of-month spreadsheets to understand where their money went. A structured expenditure analysis checklist changes that entirely. It gives you a clear, repeatable process to measure every pound spent, benchmark your performance against industry standards, and make faster, more confident decisions. This guide walks you through exactly what to track, how to calculate it, and where most restaurant owners go wrong.
Table of Contents
- Core criteria for effective expenditure analysis
- Step-by-step: The independent restaurant checklist
- Key metrics and formulas: Track what matters
- Common pitfalls and seasonal curveballs
- Digital tools to automate and simplify your checklist
- What most guides miss about restaurant expenditure analysis
- Streamline expenditure analysis with smart tools
- Frequently asked questions
Key Takeaways
| Point | Details |
|---|---|
| Track by category | Divide expenses into food, labour, and overheads to clarify what is driving your costs. |
| Benchmark regularly | Compare your spending percentages to standard industry ranges each period for early warnings. |
| Apply a repeatable checklist | A structured audit process reveals hidden issues and improvement opportunities. |
| Automate for accuracy | Digital tools like Xero or Fourth can cut admin time and reduce costly manual errors. |
| Adjust for seasonality | Budget using 13 four-week periods and monitor for wage and cost changes throughout the year. |
Core criteria for effective expenditure analysis
Before you can improve your costs, you need to know what to measure. Effective expenditure analysis starts with grouping your spending into three core areas: Cost of Goods Sold (COGS), Labour, and Overheads. Each category has a recommended percentage range based on what healthy UK restaurants typically achieve.
Here is a quick reference for the benchmarks you should be working towards:
| Cost category | Recommended % of revenue |
|---|---|
| COGS (food and drink) | 28% to 35% |
| Labour (including NI and pensions) | 25% to 35% |
| Overheads (rent, utilities, marketing) | 25% to 30% |
| Prime cost (COGS + Labour combined) | 55% to 65% |
These figures reflect standard industry benchmarks that UK restaurant accountants use to assess financial health. If your prime cost sits above 65%, that is a red flag worth investigating immediately.
Tracking prime cost weekly is one of the most powerful habits you can build. It combines your two biggest variable costs into a single indicator of operational efficiency. Many operators only look at these figures monthly, which means problems can go unnoticed for weeks. A good expense management guide will always recommend moving to a weekly rhythm as quickly as possible.
Here are the expense types you must include in your analysis:
- Food and beverage purchases (COGS)
- All wage costs including holiday pay, NI contributions, and pension
- Fixed overheads: rent, rates, insurance, and utilities
- Variable overheads: cleaning supplies, packaging, and repairs
- Marketing and promotions spend
For a detailed view of how these restaurant cost breakdowns work across different formats, it helps to review examples from restaurants similar to yours in style and price point.
Pro Tip: Many operators forget to include employer National Insurance contributions and auto-enrolment pension costs in their labour figure. These can add 15% or more on top of your basic wage bill, which pushes labour costs well beyond what payroll alone suggests. Build a habit of smart expense tracking that captures the full picture from the start.
Benchmarking against UKHospitality food cost data gives you an external reference point that goes beyond your own historical averages.
Step-by-step: The independent restaurant checklist
With your core criteria in hand, here is a detailed checklist to apply them systematically in your own business. This process is based on a structured 5-step cost audit that accountants recommend for accuracy and meaningful improvement.
- Gather your records. Collect POS sales data, supplier invoices, and payroll reports for the last 3 to 6 months. The more complete your data, the more reliable your analysis.
- Categorise every expense. Assign each line of spending to one of your three core areas: COGS, Labour, or Overheads. This is where most operators stumble because unclassified or miscoded costs distort the picture.
- Calculate each cost as a percentage of gross revenue. Divide each category total by your total revenue for the same period, then multiply by 100. Do this for each week or period separately, not just as a single average.
- Compare against your benchmarks. Use the table above to identify which categories are within range and which are not. A category sitting five or more percentage points above benchmark deserves immediate attention.
- Identify outliers and problem areas. Look for patterns: a spike in food cost in week three, a surge in labour over the weekend rota, or an overhead cost that crept up without explanation.
- Prioritise fixes with an action plan. Rank your problem areas by financial impact and tackle them one at a time. Trying to fix everything at once usually means fixing nothing properly.
Your weekly spend report checklist is a useful companion to this process, giving you a formatted template you can follow every seven days. For a broader view of what spend analysis involves, that resource breaks down the methodology in plain language.
Pro Tip: During periods of rapid price increases, such as after a National Living Wage uplift or a supply chain disruption, increase your review frequency to weekly without exception. Problems compound quickly when costs are moving fast.
Key metrics and formulas: Track what matters
Once you are following the checklist, you need to know which numbers matter most and how to calculate them accurately.
The most important formula in restaurant finance is the food cost percentage. The standard food cost calculation is:
(Beginning Inventory + Purchases during period, minus Ending Inventory) / Food Revenue x 100
For example, if you began the week with £4,000 in stock, purchased £2,500 worth of supplies, and ended with £3,200, your food cost is £3,300. If your food revenue that week was £11,000, your food cost percentage is 30%. That sits comfortably within the benchmark range.
Here is a comparison of the key metrics and their healthy ranges for UK independent restaurants:
| Metric | Formula | Healthy range |
|---|---|---|
| Food cost % | (COGS / Food Revenue) x 100 | 28% to 35% |
| Labour cost % | (Labour Cost / Revenue) x 100 | 25% to 35% |
| Prime cost % | ((COGS + Labour) / Revenue) x 100 | 55% to 65% |
| Gross profit % | ((Revenue minus COGS) / Revenue) x 100 | 65% to 72% |
Additional formulas and metrics worth tracking weekly:
- Variance: Actual cost versus theoretical cost. A variance above 2% on any line suggests waste, over-portioning, or theft.
- Revenue per labour hour: Total revenue divided by total labour hours worked. Useful for assessing rota efficiency.
- Inventory turnover: How quickly you cycle through your stock. Low turnover can signal over-ordering and spoilage risk.
For a more thorough breakdown of analysing food costs and how to connect them to your profitability targets, that guide covers each step in practical terms. A strong cost control guide also explains how to build a system around these metrics rather than just checking them occasionally.
Common pitfalls and seasonal curveballs
Even with a solid checklist and clear metrics, mistakes can creep in if you do not account for real-world variability.
The most common pitfalls in restaurant expenditure analysis include:
- Ignoring small recurring costs like software subscriptions, delivery platform fees, or minor repairs that quietly accumulate
- Benchmarking against the wrong type of restaurant (a quick-service site has different norms than a 60-cover fine dining venue)
- Forgetting to review the return on promotional spend, which often sits unexamined in the overheads category
- Conflating gross and net revenue when calculating percentages, which distorts every single metric
Seasonality is a major complicating factor. Many operators budget by calendar month, but this creates uneven period lengths that make comparison unreliable. Experienced operators use 13 four-week periods across the year instead of 12 months, giving you consistent, comparable reporting windows regardless of how many trading days fell in any given month.
"Letting waste or theft exceed 2% of revenue without investigation is one of the fastest ways to erode profitability. In a restaurant operating on 10% net margins, a 3% waste rate can cut profit by nearly a third."
The 2026 National Living Wage increase also changes your labour benchmarks significantly. If your rota has not been modelled against the new rates, your labour cost percentage may already be higher than your last analysis suggested. Restaurant bookkeeping examples show how practical period-based accounting handles these shifts more cleanly than simple monthly reporting. For broader financial management strategies, the accounting tips resource covers how to build these adjustments into your routine.
High fixed costs, such as rent and insurance, create volatility because they do not flex with your revenue in quiet periods. That is why maintaining overheads below 30% of revenue during peak trading is so important: it builds the buffer you need to survive slower weeks.
Digital tools to automate and simplify your checklist
Manual analysis is possible but far more effective with the right digital tools, which can also free up your time and improve accuracy.
Automation tools like Xero, QuickBooks, Fourth, Trail, and Jelly can reduce administrative work by 10 to 20 hours per week when implemented correctly. Here is what each category of tool typically covers:
- Xero and QuickBooks: Accounting and reconciliation, supplier invoice management, profit and loss reporting
- Fourth: Labour scheduling, payroll integration, and HR compliance for hospitality
- Trail: Digital checklists and operational task management, useful for daily and weekly review routines
- Jelly: Price monitoring and invoice analysis, helping spot supplier price creep early
Integrating your point of sale system with your accounting software is one of the highest-value steps you can take. When revenue data flows in automatically, your cost percentages update in near real-time rather than waiting for a manual data entry session at month end.
For a structured approach to building this kind of system, the guide on master expense management covers how to layer tools progressively. If you want a focused view on what automated expense tracking looks like in practice for a UK restaurant, that resource is worth reading before you commit to any software.
Pro Tip: Start automation in just one area, such as invoice capture or payroll, before expanding. Trying to automate everything at once leads to configuration errors and team resistance. Nail one process, then build from there.
What most guides miss about restaurant expenditure analysis
Most guides hand you a table of benchmarks and call it done. The truth is that benchmarks are a starting point, not a destination. Your own numbers, tracked consistently over time, tell you far more than any industry average.
The best independent operators we have seen do something different: they use their weekly checklist as a conversation prompt with their team. When food cost crept up 3% in a fortnight, the conversation with the kitchen team revealed a supplier had quietly changed pack sizes. That insight took two minutes to surface and saved thousands over the following quarter.
Digital tools make the data easier to collect, but human judgement is what turns data into action. The operators who genuinely control their costs combine automated tracking with a regular, disciplined review habit. They treat the checklist not as a box-ticking exercise but as an early warning system.
For independents, agility in supplier negotiation matters far more than scale. When you spot a cost trend early using your own financial data, you have time to act: renegotiate terms, adjust your menu engineering, or change your ordering pattern before the problem compounds. That responsiveness is your competitive advantage over larger groups who move slowly.
Streamline expenditure analysis with smart tools
Turning your checklist into a consistent weekly habit is much easier when the heavy lifting is done automatically. Kosts was built by a working chef who understood exactly how painful manual cost tracking is in a real restaurant environment.
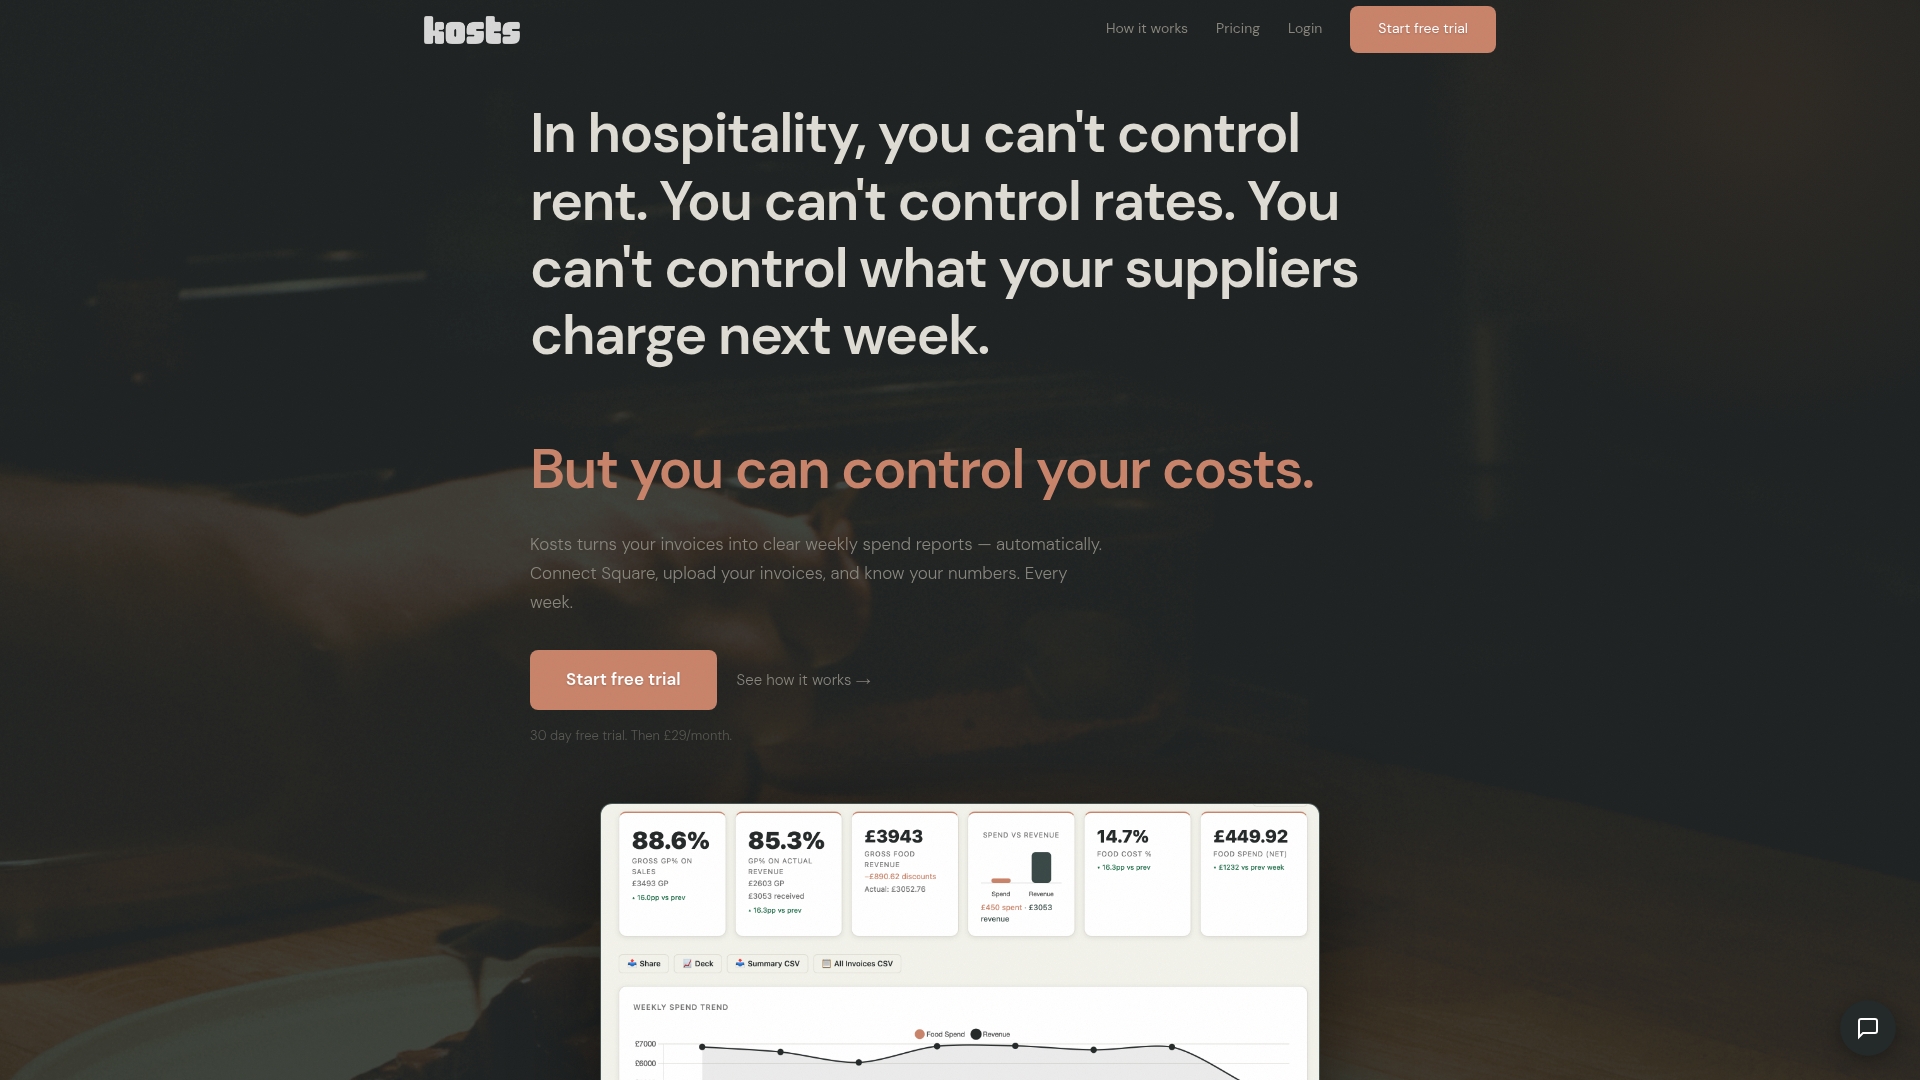
With Kosts, you can upload invoices by photo, PDF, or email forward, and the platform automatically extracts supplier, item, category, and cost data. Revenue syncs directly from Square or Xero, so your food cost percentage and prime cost update without manual input. Your weekly spend report is ready without a spreadsheet in sight. Try Kosts free for 30 days and see how much time and clarity a purpose-built tool gives your restaurant.
Frequently asked questions
What is included in a restaurant expenditure analysis checklist?
The checklist covers all major spending areas including food, labour, and overheads, with each cost category benchmarked against industry standards to identify where savings are possible.
How often should I review my restaurant's expenditure using this checklist?
Aim for monthly reviews as a minimum, but track prime costs weekly for best results, as weekly prime cost tracking gives you the earliest possible warning of margin pressure.
Which software is best for automating expenditure analysis in UK restaurants?
Xero, QuickBooks, Fourth, Trail, and Jelly are all widely used, with each offering automation for different tasks such as invoicing, payroll, and operational checklists.
What percentage of sales should be spent on labour and food in my restaurant?
Keep food costs between 28% and 35% of sales and labour between 25% and 35%, targeting a combined prime cost of 55 to 65% for a healthy operating position.