
TL;DR:
- Expenditure analysis provides precise insights into restaurant costs by categorizing spending accurately.
- Regularly tracking prime cost and benchmarking against industry standards helps control profitability.
- Automation tools streamline data collection, enabling proactive decisions and improved cost management.
Most independent restaurant owners assume that cutting costs means negotiating better supplier prices or trimming the menu. That instinct is understandable, but it rarely solves the underlying problem. Without a structured breakdown of where every pound actually goes, you are essentially guessing. Expenditure analysis changes that. It replaces gut feeling with data, giving you a precise picture of your spending across every category. This guide explains what expenditure analysis means for UK restaurants, how to carry it out step by step, and how to use the results to make genuinely impactful decisions.
Table of Contents
- What is expenditure analysis in UK restaurants?
- Steps to perform effective expenditure analysis
- Understanding benchmarks and interpreting results
- Common pitfalls and advanced insights in expenditure analysis
- Our perspective: What most UK restaurants miss about expenditure analysis
- Put smarter cost control into action
- Frequently asked questions
Key Takeaways
| Point | Details |
|---|---|
| Breakdown is vital | Dissecting expenses by category reveals hidden savings opportunities and cost problems. |
| Benchmarks guide action | Comparing your numbers to UK standards enables targeted improvements and smart decisions. |
| Focus on prime cost | Food and labour costs together have the greatest influence on your restaurant's profitability. |
| Analyse regularly | Consistent reviews help you spot emerging issues and avoid margin erosion before it's too late. |
What is expenditure analysis in UK restaurants?
At its core, restaurant spend analysis is the systematic process of dissecting your operating expenses into defined categories so you can understand exactly where your money is going. According to financial breakdown guidance, expenditure analysis for UK independent restaurants involves breaking costs into groups such as Cost of Goods Sold (COGS), labour, overheads, and marketing, then benchmarking those figures against industry standards to identify variances and develop cost control strategies.
The four main categories you should be tracking are:
- Cost of Goods Sold (COGS): The direct cost of the food and drink you sell, including wastage
- Labour: Wages, National Insurance contributions, and any agency or temporary staffing costs
- Overheads: Rent, utilities, insurance, repairs, and other fixed or semi-fixed costs
- Marketing: Social media advertising, promotions, printed materials, and any agency fees
The purpose is threefold: clarity, benchmarking, and action. Clarity means knowing your actual numbers rather than estimates. Benchmarking means comparing your figures against what similar UK restaurants spend. Action means using the gaps to make targeted changes.
One of the most damaging mistakes operators make is miscategorising expenses. When delivery surcharges get lumped into general overheads instead of COGS, your food cost percentage looks artificially low. When staff training costs sit under marketing, your labour line appears lean. These misallocations create a distorted picture, and decisions made on distorted data are rarely good ones.
Here is a quick comparison of what structured analysis looks like versus informal cost reviews:
| Approach | Frequency | Depth | Outcome |
|---|---|---|---|
| Informal review | Ad hoc | Surface level | Reactive decisions |
| Structured expenditure analysis | Weekly or monthly | Category level | Proactive cost control |
| Automated reporting | Real time | Item and supplier level | Continuous improvement |
The structured approach is not reserved for large restaurant groups. Even a single-site independent with a small team can apply it consistently and see meaningful results within a few weeks.
Steps to perform effective expenditure analysis
Now that you understand the what and why, here is exactly how to carry out expenditure analysis in your restaurant.
The step-by-step cost analysis methodology most commonly recommended involves five clear stages:
- Gather 3 to 6 months of financial records. Pull data from your point-of-sale system, supplier invoices, and payroll. The more complete the data, the more reliable the analysis. Gaps in records lead to gaps in insight.
- Categorise your expenses. Use accounting software such as Xero or QuickBooks to assign every cost to its correct category. Consistency matters here. If you change how you categorise something mid-analysis, your comparisons become meaningless.
- Calculate each category as a percentage of total revenue. This is the critical step. Absolute numbers tell you what you spent. Percentages tell you whether that spending is proportionate. A £4,000 food cost looks very different at 25% revenue versus 40% revenue.
- Compare against benchmarks and your own historical data. Look for categories that are trending upward or sitting above industry norms. These are your priority areas.
- Identify deviations and build an action plan. A deviation without a response is just a data point. Assign ownership, set targets, and review progress.
Pro Tip: When using automated expense tracking, set up category rules in your software so that every invoice is automatically assigned to the right cost centre. This removes human error and saves significant time each week.
Two common mistakes trip up operators at this stage. First, ignoring secondary costs such as delivery fees, packaging, and credit card processing charges. These can add up to 2 to 4% of revenue and are often invisible in informal reviews. Second, failing to account for VAT correctly. If you are comparing VAT-inclusive figures against VAT-exclusive benchmarks, your numbers will never align. Always work from VAT-exclusive totals.
For efficient expense management, build a simple weekly habit: review your prime cost (food plus labour) every Monday morning using the previous week's data. This single habit catches problems early, before they compound.
Understanding benchmarks and interpreting results
Once you have collected and organised your expense data, understanding what the numbers mean requires context. Benchmarks provide that context.
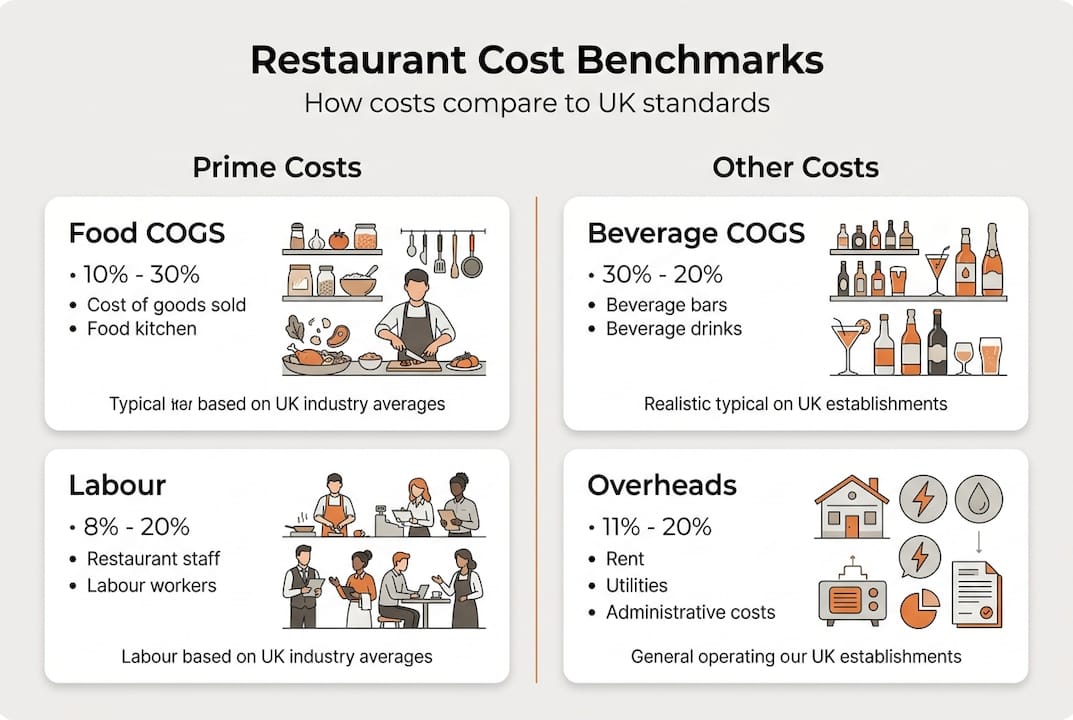
UK restaurant profit benchmarks give independent operators a reliable reference point. Here is what healthy performance typically looks like:
| Cost category | UK benchmark range |
|---|---|
| Food COGS | 28 to 32% of revenue |
| Beverage COGS | 18 to 24% of revenue |
| Labour | 25 to 35% of revenue |
| Overheads | 10 to 18% of revenue |
| Prime cost (food + labour) | 55 to 65% of revenue |
| Net profit (independents) | 3 to 6% of revenue |
These figures are not rigid rules, but they are a useful starting point. A quick-service restaurant will typically sit at the lower end of the labour range. A fine dining venue may carry higher labour costs but offset them with stronger beverage margins.
When you spot a gap between your figures and these benchmarks, ask why before acting. A food cost of 38% might reflect genuine waste, poor portioning, or supplier price increases. It might also reflect a deliberate decision to use premium ingredients as a brand differentiator. Context matters.
Here is how to translate percentage gaps into practical actions:
- Food cost above 32%: Audit portion sizes, review supplier pricing, and check waste logs
- Labour above 35%: Review scheduling patterns, compare hours to covers, and assess whether peak staffing matches actual demand
- Overheads above 18%: Scrutinise utility usage, renegotiate fixed contracts, and identify any recurring costs that no longer serve a purpose
Pro Tip: When managing expenses in 2026, do not compare yourself solely to national averages. Build your own internal benchmarks over 12 months and treat month-on-month variance as your primary signal. Your restaurant's own trend line is often more actionable than an industry average.
The tracking process for higher profits becomes far more powerful when you pair benchmarks with your own historical data. Seeing that your food cost has crept up 3 percentage points over six months is more alarming than knowing it sits slightly above a national average.
Common pitfalls and advanced insights in expenditure analysis
Even with a solid grasp of the basics, there are hidden challenges that can undermine your analysis if you are not careful.
Secondary costs are the most frequently overlooked category. Delivery surcharges, supplier minimum order fees, and platform commissions from services like Deliveroo or Uber Eats rarely appear as a named line in a P&L. They get absorbed into broader categories and quietly inflate your COGS. Identifying and isolating these costs gives you a clearer picture of your true margin on each revenue channel.
As noted in UK food cost insights, secondary costs such as delivery surcharges and supplier minimums, combined with waste running at 8 to 12% of food spend and labour allocated to food service at 40 to 50%, represent a significant and often untracked drain on profitability.
Waste is not a kitchen problem. It is a financial problem that starts in the kitchen. Tracking it weekly as a percentage of food spend is one of the most direct levers any independent restaurant has on its margin.
VAT is another area where analysis goes wrong. In the UK, the standard VAT rate is 20%. If you are reviewing invoices that include VAT without stripping it out first, your cost figures are inflated by a fifth. Always confirm whether your accounting software is reporting VAT-exclusive or VAT-inclusive figures before drawing any conclusions.
For operators running more than one site, recipe and supplier inconsistency creates a separate challenge. If your two kitchens are buying the same ingredient from different suppliers at different prices, your COGS figures will diverge in ways that have nothing to do with performance.
The most effective food cost tracking tips for independent restaurants point to a consistent rhythm: review prime cost weekly, conduct a full expenditure analysis quarterly, and run a deeper supplier and waste audit twice a year. This cadence catches problems early without overwhelming a small management team.
For those ready to go further, optimising cost tracking means treating your kitchen like a production line: every input has a cost, every output has a value, and the gap between them is your margin to protect.
Our perspective: What most UK restaurants miss about expenditure analysis
Most independent operators review their costs when something feels wrong. A bad month, a supplier invoice that looks higher than expected, a conversation with an accountant at year end. That reactive pattern is exactly why margin erosion is so common and so slow to detect.
The restaurants that consistently protect their profitability treat expenditure analysis as a weekly discipline, not an annual task. They look at prime cost every single week. They flag waste before it becomes a habit. They notice when a supplier's prices have quietly increased by 4% over three months.
There is also a mindset shift worth making. Most owners think of their kitchen as a creative space. The most profitable ones think of it as a production environment where every input and output is measurable. That is not about removing creativity. It is about giving creativity a financial framework to operate within.
Real-time cost tracking tips consistently show that automation is the enabler here. When your data updates automatically, you spend less time gathering numbers and more time acting on them. The signal arrives before the problem becomes a crisis.
Put smarter cost control into action
Understanding expenditure analysis is one thing. Having a system that does the heavy lifting for you is another.
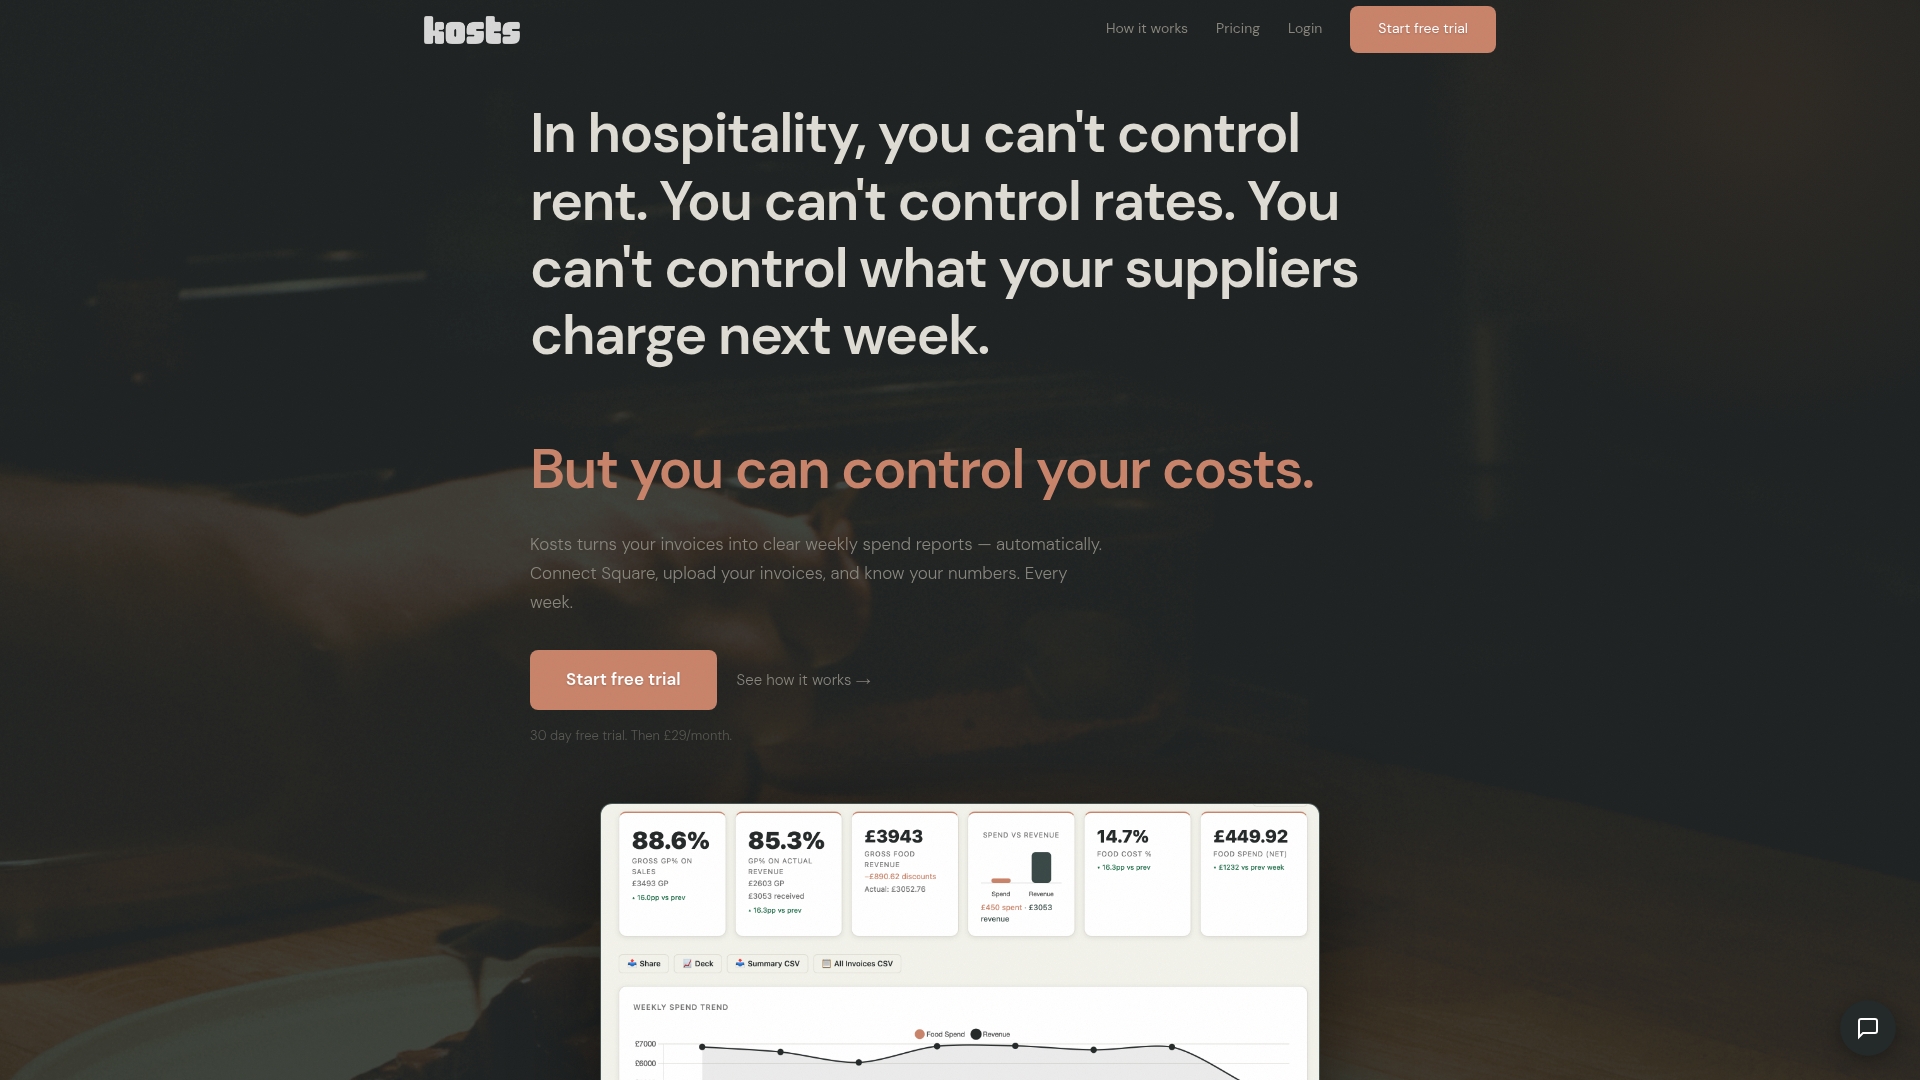
Kosts was built specifically for independent UK restaurants by someone who has worked in professional kitchens. It converts your invoices into automated weekly spend reports, categorises costs by supplier and item, and gives you a live view of your food cost percentage and gross profit. You can upload invoices by photo, PDF, or email, and it connects directly with Xero and Square for seamless revenue syncing. If you want to explore advanced restaurant cost control tools that actually fit how a working kitchen operates, Kosts offers a 30-day free trial with no complexity and no long-term commitment.
Frequently asked questions
How often should I perform expenditure analysis in my restaurant?
Quarterly analysis is the minimum recommended frequency, but tracking prime cost on a weekly basis ensures you catch margin issues before they escalate into serious problems.
What is included in prime cost, and why does it matter?
Prime cost is the combined total of your food and labour expenses. Because it typically accounts for 55 to 65% of revenue, controlling it has a greater impact on net profit than any other single measure.
Why do VAT calculations affect my expense analysis?
The UK standard VAT rate of 20% inflates apparent costs if included in your figures, which distorts category percentages and makes accurate benchmarking impossible. Always use VAT-exclusive totals.
What is one edge case that many overlook in cost tracking?
Delivery surcharges and supplier minimums are frequently absorbed into broad cost categories rather than tracked separately, which distorts your true COGS and makes it harder to assess the profitability of individual revenue channels.