
TL;DR:
- Many UK independent restaurants mismanage food cost percentage by focusing solely on lowering ingredient costs.
- Automation tools improve accuracy, save time, and provide real-time insights crucial for managing prime costs.
- Over-optimizing FCP can harm quality and profitability; comprehensive tracking and deliberate decision-making are essential.
Most independent restaurants in the UK are either leaving money on the table or cutting costs in ways that quietly damage quality. Food cost percentage (FCP) is one of the most misunderstood metrics in the business, yet it sits at the heart of every profitable menu decision you make. Many owners fixate on driving it as low as possible, not realising that prime cost pressures from rising UK wages mean the full picture is far more nuanced. This guide will cut through the confusion, give you a clear calculation method, flag the most common mistakes, and show you how automation makes the whole process far less painful.
Table of Contents
- What is food cost percentage and why does it matter?
- Calculating food cost percentage: a step-by-step workflow
- Common pitfalls and how to avoid them
- Optimising and tracking food costs with automation
- The uncomfortable truth about food cost percentage
- Next steps: automated tools for smarter food cost reporting
- Frequently asked questions
Key Takeaways
| Point | Details |
|---|---|
| FCP drives profitability | Food cost percentage is a key metric for restaurant finance and profit control. |
| Calculation must be precise | Accurate and consistent FCP calculation prevents costly mistakes and supports smart decisions. |
| Automation offers visibility | Automated tools save time and reveal actionable insights as wage costs rise. |
| Prime cost is central | Tracking both food and labour costs together gives context and leads to sustainable profits. |
| Frequent reviews prevent errors | Regularly auditing FCP lets owners catch issues early and refine operations for success. |
What is food cost percentage and why does it matter?
Food cost percentage is the proportion of your revenue that you spend on ingredients. The formula is straightforward: divide your total food costs by your total food revenue, then multiply by 100. If you spend £3,000 on ingredients and bring in £10,000 in food sales, your FCP is 30%. Simple enough on paper, but the implications run deep.
FCP does not exist in isolation. It is part of prime cost, which combines food costs and labour costs together. Prime cost is the single most important indicator of whether your restaurant is financially viable. Most operators should aim to keep prime cost below 65% of revenue, which means food and labour together must stay within that ceiling. Understanding prime cost targets gives your FCP real context rather than leaving it as an abstract number.
So what is a realistic FCP target? It varies by concept, but here are typical benchmarks:
- Fine dining: 28% to 35% (higher ingredient quality justified by higher ticket prices)
- Casual dining: 28% to 32%
- Fast casual or takeaway: 25% to 30%
- Cafés and brunch spots: 30% to 38% (high coffee margins can offset food costs)
These ranges are starting points, not rigid rules. A restaurant running a 38% FCP but a 55% prime cost is in a healthier position than one with a 28% FCP and a 72% prime cost.
Common misconception: Many owners believe that a lower food cost percentage always means a more profitable restaurant. In reality, slashing ingredient costs can reduce dish quality, drive away loyal customers, and ultimately cost far more in lost revenue than the saving was worth.
Pro Tip: Use FCP as a decision-making tool, not just a reporting figure. When you are considering a new dish, a supplier switch, or a price increase, run the FCP calculation first. It turns a gut feeling into a business case.
Calculating food cost percentage: a step-by-step workflow
Having established what food cost percentage is, let's see exactly how to calculate it accurately and reliably. Proper food cost calculation is essential for making sound management decisions, and errors at this stage ripple through every other financial metric you track.
Here is the standard process:
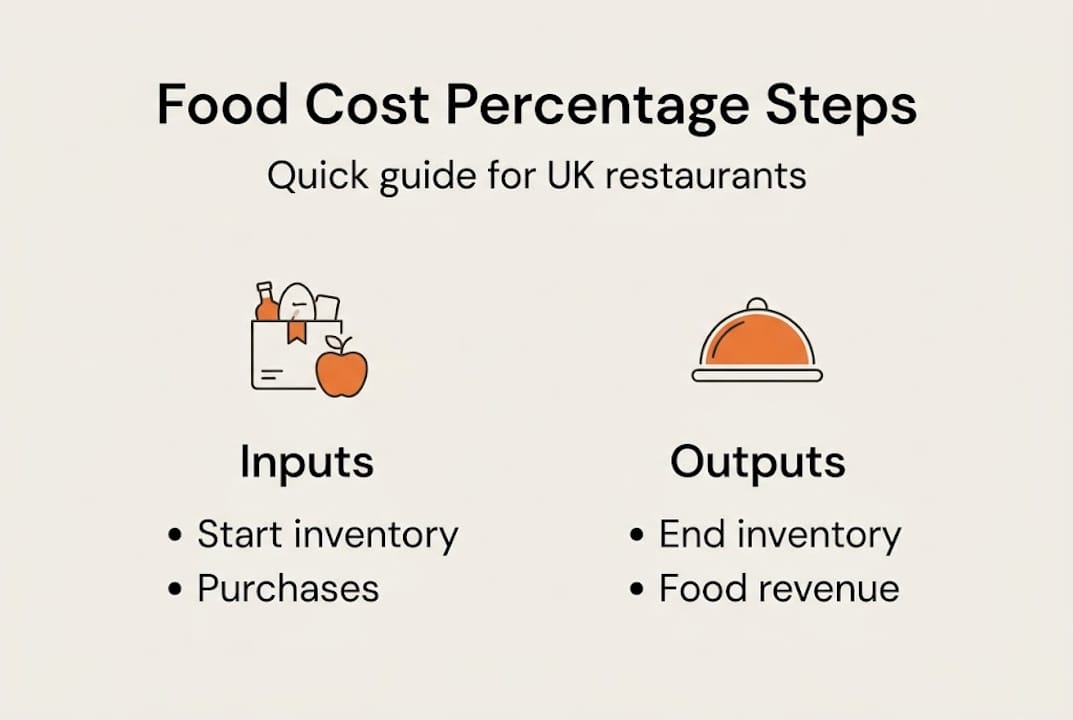
- Record your opening inventory value at the start of the period (weekly or monthly).
- Add all purchases made during that period, using actual invoice totals from your suppliers.
- Subtract your closing inventory value to get the cost of goods used.
- Divide by total food revenue for the same period.
- Multiply by 100 to express it as a percentage.
The formula written out: (Opening inventory + Purchases minus Closing inventory) divided by Food revenue, multiplied by 100.
For a step-by-step calculation with worked examples, it helps to see this applied to a real week's trading data. Most operators who do this manually find the process takes between one and three hours per week, which adds up fast.
Here is a comparison of common calculation approaches:
| Method | Accuracy | Time required | Best for |
|---|---|---|---|
| Manual spreadsheet | Moderate | High | Very small operations |
| POS system reports | Moderate to high | Medium | Established single sites |
| Automated invoice scanning | High | Low | Growing independents |
| Accounting software only | Low to moderate | Medium | Operators with accountants |
A few errors come up repeatedly. Operators often forget to account for staff meals, wastage, or complimentary dishes, all of which inflate apparent revenue against actual food spend. Others use estimated purchase figures rather than actual invoice totals, which introduces drift over time.
Labour costs interact with FCP in a subtle way. When wages rise, operators sometimes try to compensate by tightening food costs, which can distort the picture. The better approach is to track both within prime cost, using accounting tips designed specifically for hospitality.
Pro Tip: Consistency matters more than complexity. A simple method applied every week beats a sophisticated method done quarterly. Pick a calculation day, stick to it, and your trend data becomes genuinely useful.
Common pitfalls and how to avoid them
With the calculation steps in place, it is vital to address the barriers and mistakes that undermine FCP accuracy. Even owners who understand the formula often find their numbers are unreliable because of process failures rather than maths errors.
The most damaging pitfalls include:
- Inaccurate inventory counts: Estimating stock levels rather than physically counting them introduces errors that compound week on week.
- Ignoring supplier price changes: If a supplier quietly raises prices and you do not update your records, your FCP will look artificially low until a stocktake reveals the gap.
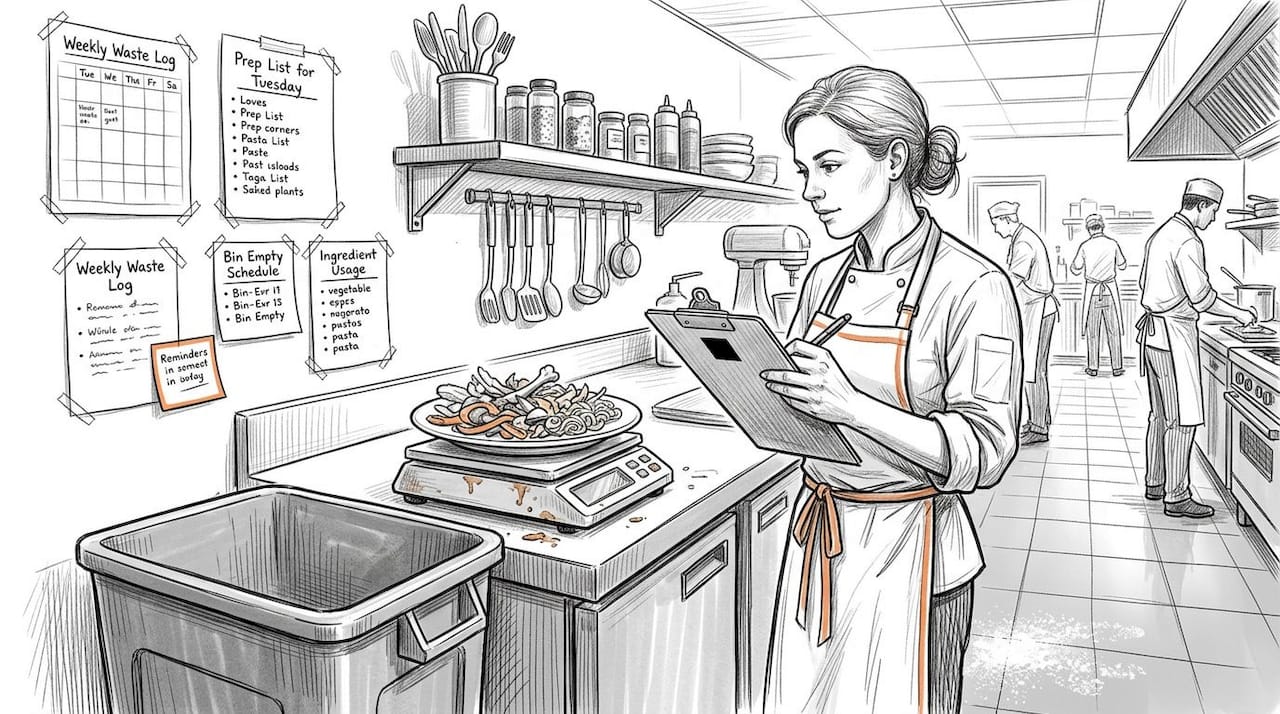
- Not tracking waste: Food that is spoiled, over-portioned, or sent back still costs money. Ignoring it means your calculated FCP understates your real cost.
- Mixing catering and retail: If you sell packaged goods alongside cooked food, blending the revenue streams distorts your FCP.
- Irregular review cycles: Checking FCP monthly when your menu changes weekly means you are always reacting to old data.
The fix for most of these is process discipline, and increasingly, automation. Rising minimum wage makes efficient food cost control more critical than ever, because every percentage point of margin matters more when your labour bill is climbing. Reviewing your cost control checklist regularly is one of the most practical habits you can build.
Waste tracking deserves particular attention. Research from WRAP suggests UK hospitality businesses waste around 1.1 million tonnes of food per year. Even a modest reduction in your own kitchen waste can shift your FCP by one or two percentage points without any change to your menu or supplier terms.
Pro Tip: Automate your invoice capture. When supplier costs are logged automatically rather than entered by hand, you eliminate the most common source of FCP error at its root. Tools that support monitoring food costs in real time make this straightforward.
Optimising and tracking food costs with automation
Once you know the pitfalls, the next step is truly optimising food cost management, and that means leveraging automation. Manual tracking worked when margins were wider and menus were simpler. In 2026, with wage costs rising and ingredient prices volatile, the gap between operators who automate and those who do not is widening fast.
Automation is becoming indispensable for visibility as UK labour costs rise. Here is what it actually delivers in practice:
- Accuracy: Invoice data is extracted automatically, removing manual entry errors from supplier cost records.
- Time saved: What takes hours in a spreadsheet takes minutes when invoices are scanned and categorised automatically.
- Real-time visibility: You can see your food cost percentage update as the week progresses, not just after a monthly stocktake.
- Supplier benchmarking: Automated systems can flag when a supplier's prices drift upward, so you are never caught off guard.
- Fraud reduction: Automatic reconciliation of invoices against deliveries makes it harder for errors or overcharges to go unnoticed.
The practical steps for moving to automated cost tracking are simpler than most operators expect. You start by uploading invoices digitally, either by photo, PDF, or email forwarding. The system extracts the supplier, items, and costs. Your weekly FCP is calculated automatically against revenue data pulled from your till or payment system.
For operators looking to go further, smart expense tracking connects invoice data to category-level breakdowns, so you can see exactly where your spend is going across meat, dairy, produce, and dry goods. Combining this with the food cost tracking tips that experienced operators use gives you a genuinely competitive edge.
The uncomfortable truth about food cost percentage
Here is something most guides will not tell you: obsessing over a low FCP can actually make your restaurant less profitable. We have seen UK operators cut ingredient quality to hit a 26% food cost, only to watch their average spend per cover drop as customers noticed the difference. The maths looked better on paper. The business suffered in reality.
Food cost percentage is a contextual benchmark, not a target to minimise at all costs. The operators who thrive are the ones who track it consistently, understand what is driving it, and make deliberate decisions rather than reactive cuts. Automated visibility is what makes that possible. When you can see your FCP update weekly alongside your prime cost, you stop chasing a single number and start managing a complete picture.
The cost reports guide we have built for UK independents reflects exactly this philosophy. Real control comes from understanding, not from squeezing every penny out of your supplier relationships.
Next steps: automated tools for smarter food cost reporting
If the manual spreadsheet approach is costing you hours every week and still leaving you uncertain about your true food cost percentage, there is a better way.
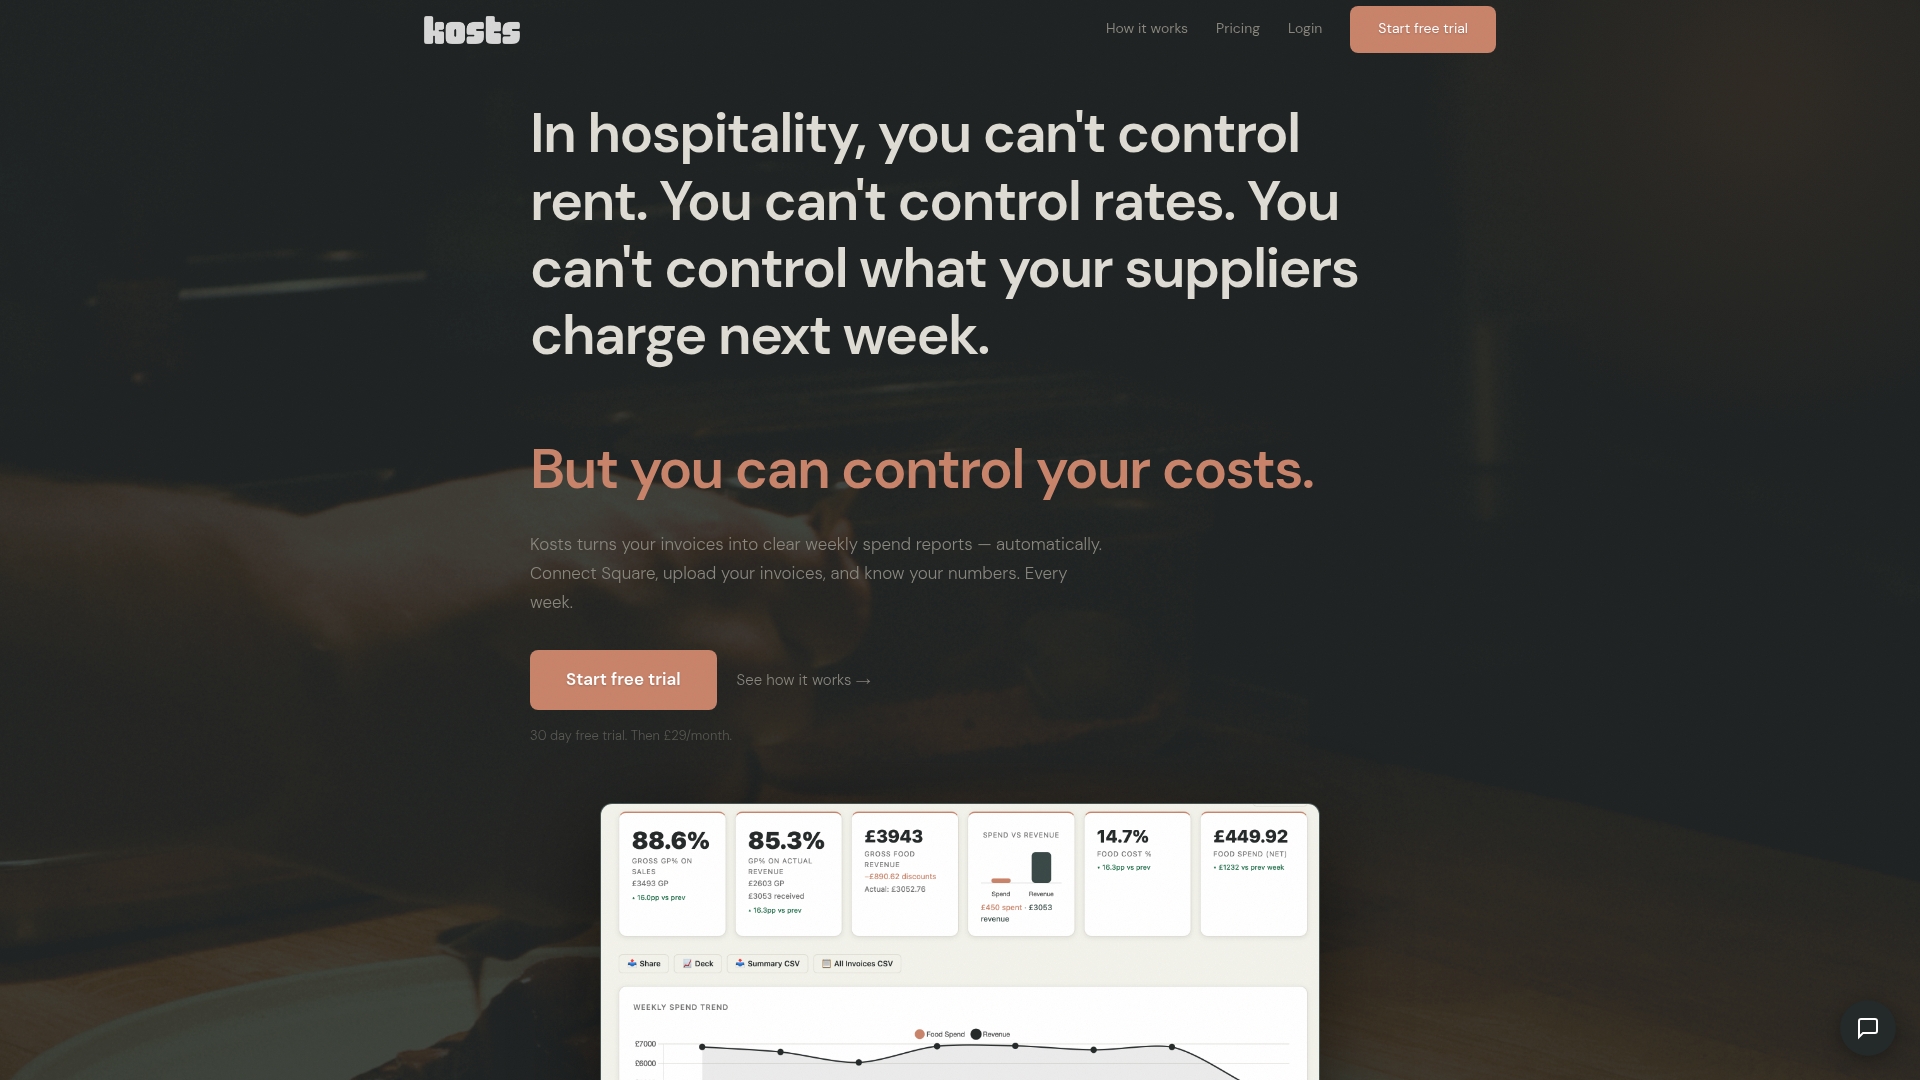
Kosts is built specifically for independent UK restaurants, by someone who has worked in professional kitchens. You upload invoices by photo, PDF, or email, and the platform automatically extracts supplier, item, and cost data. Your food cost percentage, gross profit, and spend breakdowns update in real time. It connects with Square and Xero, so your revenue data flows in automatically. There is a 30-day free trial, no complex setup, and no enterprise pricing. Just clear numbers, every week.
Frequently asked questions
What is a good food cost percentage for UK restaurants in 2026?
Most successful UK restaurants target a food cost percentage between 25% and 35%, as part of a total prime cost under 65% of revenue.
How often should I review and update my food cost percentage?
You should review your food cost percentage weekly or monthly depending on volume and menu changes, as regular reviews are essential for maintaining profitability.
Can automated tools help with food cost tracking?
Yes, automation reduces errors and saves time, giving you clearer insight into food costs. Automation is indispensable for visibility as costs and complexity grow.
What are the most common mistakes in calculating FCP?
Failing to track inventory accurately or update supplier costs are two frequent errors. These common calculation errors undermine accuracy and lead to poor decisions.
How does the rising minimum wage affect food cost management?
Higher wages increase pressure on margins, making efficient food cost control through automation essential. Wage rises intensify the need for real-time visibility across all cost categories.