Managing a restaurant's finances goes far beyond keeping receipts in order. Many independent owners believe that basic bookkeeping covers their bases, yet this approach leaves the most damaging profit leaks completely invisible. Cost reports are the tool that changes this picture entirely, turning raw invoice data into actionable weekly intelligence. This guide breaks down what cost reports are, which metrics matter most, how to spot common cost leaks early, and how automation is helping UK independents save thousands every month. If you want to protect your margins in a squeezed market, understanding cost reports is non-negotiable.
Table of Contents
- What are cost reports and why do they matter?
- The key metrics every restaurant should track
- Common pitfalls and cost leaks you can spot early
- From paperwork to profit: How automation transforms cost reporting
- Making cost reports work: Proven habits and UK best practices
- The overlooked edge: Why most restaurants underuse cost reports
- Ready to streamline your cost control?
- Frequently asked questions
Key Takeaways
| Point | Details |
|---|---|
| Cost reports reveal profit leaks | Regular cost reporting exposes hidden drains on revenue, making proactive action possible. |
| Key metrics drive smart decisions | Tracking food, labour, prime cost, and COGS each week gives owners data to fix issues early. |
| Automation boosts savings | Modern software slashes manual effort and has proven to save thousands each month for UK restaurants. |
| Best results need routine | Cost reporting becomes most effective when it’s a weekly habit, not a seasonal admin task. |
What are cost reports and why do they matter?
Cost reports are structured summaries of your restaurant's key expense categories, reviewed on a regular basis to guide operational decisions. They go well beyond a profit and loss statement. Where a P&L tells you what happened last quarter, a cost report tells you what is happening right now, and more importantly, why.
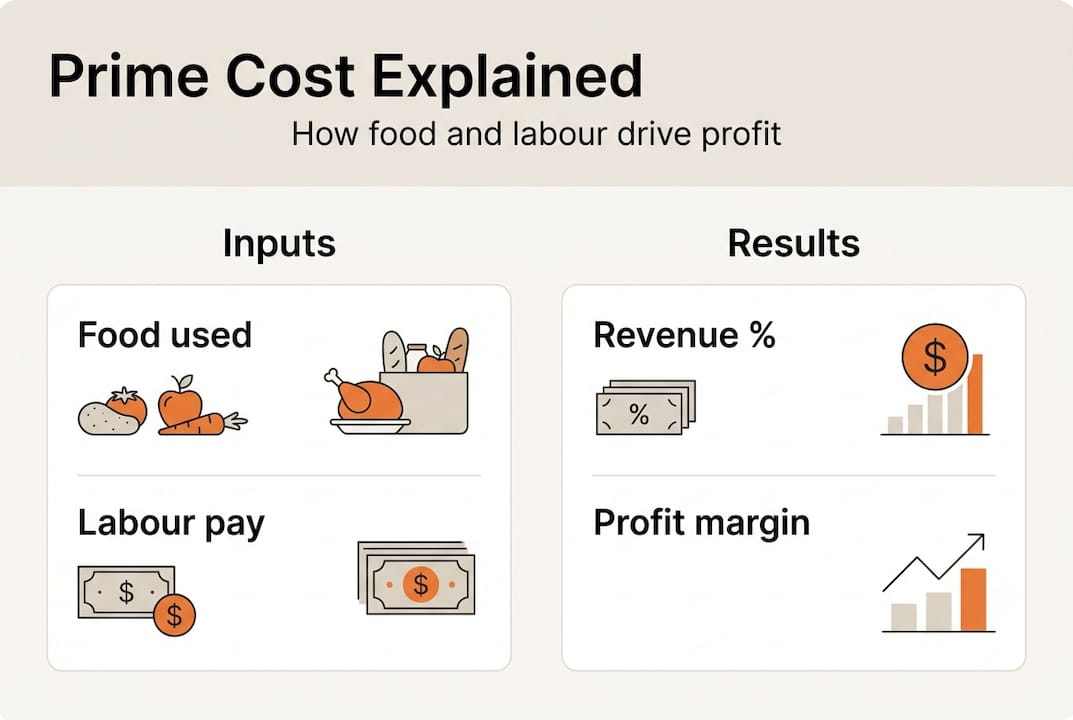
The most critical figure in any cost report is your prime cost, which is the combined total of food and labour expenses. Prime cost should sit between 55% and 65% of your total revenue. If it creeps above that band, your profitability is under real pressure. It is the single most telling number in your business.
The main types of cost reports you should be running include:
- Weekly food cost report: tracks ingredient spend against sales
- Labour cost report: monitors wages, overtime, and scheduling efficiency
- Delivery commission report: captures third-party platform fees (typically 15-35% per order)
- COGS (cost of goods sold) report: measures the direct cost of producing your menu
- Multi-site comparison report: benchmarks performance across locations
Here is a simple snapshot of what a weekly cost summary might look like:
| Metric | This week | Target |
|---|---|---|
| Food cost % | 32% | 28-32% |
| Labour cost % | 28% | 25-30% |
| Prime cost % | 60% | 55-65% |
| Delivery commissions | £420 | Under £400 |
Understanding how financial data drives success is not just for large chains. UK operators who check these numbers weekly, rather than monthly, consistently catch problems before they compound. A weekly spend report checklist can make this habit easy to maintain.
"The difference between a restaurant that survives and one that thrives is rarely the menu. It is almost always the owner's grip on their numbers."
The key metrics every restaurant should track
Knowing which numbers to watch is half the battle. Here are the core metrics that deserve your attention every single week.
Prime cost is food plus labour, expressed as a percentage of revenue. Food cost is your ingredient spend divided by food sales. COGS covers all direct costs tied to producing what you sell. Labour cost includes wages, National Insurance contributions, and any overtime.
The formula for weekly food cost is straightforward:
(Opening inventory + Purchases this week - Closing inventory) ÷ Food sales × 100
For example: if you start the week with £2,000 of stock, purchase £1,500 more, and end with £1,800, your food used is £1,700. If your food sales were £5,500, your food cost percentage is 30.9%. That is a healthy figure.
| Input | Amount |
|---|---|
| Opening inventory | £2,000 |
| Purchases | £1,500 |
| Closing inventory | £1,800 |
| Food used | £1,700 |
| Food sales | £5,500 |
| Food cost % | 30.9% |
Once you have your actual food cost, compare it against your theoretical food cost, which is what your cost should be based on recipes and portion sizes. A variance under 2% between actual and theoretical signals strong operational control. Anything above that warrants investigation.
The metrics to review every week, without exception:
- Prime cost percentage
- Food cost percentage
- Labour cost percentage
- COGS versus revenue
- Delivery platform commissions
For a deeper look at analysing food costs and building tighter controls, a food cost control checklist is a practical starting point. Consistent tracking of food costs week on week reveals trends that a single monthly snapshot will always miss.
Common pitfalls and cost leaks you can spot early
Knowing the numbers is only half the battle. Successful restaurants use cost reports to proactively catch and correct issues before profits slip away.
One of the most underestimated problems is portion drift. When kitchen staff gradually serve slightly larger portions, particularly on proteins, costs can inflate by 6-18% without a single person noticing. On a dish costing £4.50 to produce, even a 10% drift adds up to thousands over a year.
Common cost leaks that cost reports will expose:
- Portion drift on proteins: small overages compound into major losses
- Untracked waste: food thrown away without logging skews your true food cost
- Supplier price creep: incremental price increases on invoices that go unchallenged
- Delivery platform commissions: fees of 15-35% per order that erode already thin margins
- Overtime accumulation: unplanned extra hours, particularly under UK wage rules, that inflate labour costs
- Multi-site inconsistencies: one location running significantly higher costs than another
"Small leaks sink big ships. A restaurant turning over £500,000 per year losing just 3% to untracked waste is handing away £15,000 annually."
Pro Tip: Keep a daily waste log and compare your supplier invoices line by line each week. It takes less than 15 minutes and will almost certainly reveal a discrepancy worth acting on.
For practical cost control examples and essential budgeting tips, building these habits early is far easier than trying to reverse months of unchecked drift.
From paperwork to profit: How automation transforms cost reporting
Once you know your cost leaks, the next step is moving from reactivity to proactive mastery. This is where automation makes a decisive difference.
The old way meant stacks of paper invoices, manual spreadsheet entry, and a monthly scramble to reconcile figures that were already weeks out of date. The new way means uploading an invoice photo, having the data extracted automatically, and seeing your food cost percentage update in real time.
| Feature | Manual reporting | Automated reporting |
|---|---|---|
| Speed | Days to compile | Real-time updates |
| Accuracy | Prone to data entry errors | AI extraction reduces errors |
| Compliance | Easy to miss records | Full audit trail maintained |
| Outcomes | Reactive fixes | Proactive cost management |
| Time cost | 5-10 hours per week | Under 30 minutes per week |
The results speak clearly. Restaurants using automated cost reporting tools save £3,000 to £4,000 per month and achieve a 5% reduction in food cost. Wagamama's adoption of automation delivered a 60% improvement in compliance and saved the equivalent of one to two full-time roles. These are not marginal gains.
Pro Tip: Schedule a fixed 30-minute slot each Monday morning to review your automated dashboard. This single habit builds a cost-conscious culture across your whole team.
To master expense management in your restaurant, automated expense tracking removes the friction that causes most owners to delay their reviews. A clearly defined cost control workflow is what separates operators who react to problems from those who prevent them.
Making cost reports work: Proven habits and UK best practices
Armed with new tools, the final piece is habit. Here is how successful UK restaurants make cost control second nature.
Tracking weekly rather than monthly is the single most impactful change most independents can make. A monthly review means a problem that started in week one is not caught until week four or five. By then, the damage is done.
Steps to build an effective cost reporting habit:
- Choose one primary metric to start with, ideally prime cost
- Set a fixed weekly review time and protect it like a shift briefing
- Share the dashboard with your head chef and floor manager
- Create a simple action log: what changed, why, and what you will do about it
- Review supplier invoices alongside cost data to spot price creep early
- Expand your tracking to include food cost, labour, and delivery commissions once the habit is established
Pro Tip: Start with just prime cost. Once you can explain it to your team without notes, add the next metric. Complexity is the enemy of consistency.
| Practice | Outcome |
|---|---|
| Weekly prime cost review | Early warning on margin squeeze |
| Daily waste logging | Accurate food cost data |
| Supplier invoice audits | Catches price creep before it compounds |
| Team dashboard visibility | Builds shared accountability |
| Monthly trend comparison | Reveals seasonal patterns |
A weekly spend report checklist is a simple way to formalise this routine without overcomplicating it.
The overlooked edge: Why most restaurants underuse cost reports
Here is a candid truth that most industry advice glosses over. The majority of UK independent restaurants that do run cost reports treat them as a compliance exercise rather than a competitive weapon. They check the numbers, note whether they are above or below target, and move on. That is not cost management. That is box-ticking.
The real leverage is in acting on trends. If your chicken dish is consistently pushing your food cost above 33%, that is a menu engineering conversation. If one supplier's prices have risen 8% over three months, that is a negotiation or a switch. If your Tuesday labour cost is disproportionately high relative to covers, that is a scheduling fix.
Data-driven restaurant profits come from operators who use cost reports to make decisions, not just to document history. With automated tools now accessible to even the smallest independent, there is genuinely no excuse to fly blind. The restaurants that build a genuine culture of cost consciousness, where the team understands the numbers and takes pride in hitting targets, will set the pace in a market where margins continue to tighten.
Ready to streamline your cost control?
If the habits and metrics in this guide feel like a lot to manage manually, you are right. That is exactly the problem Kosts was built to solve.
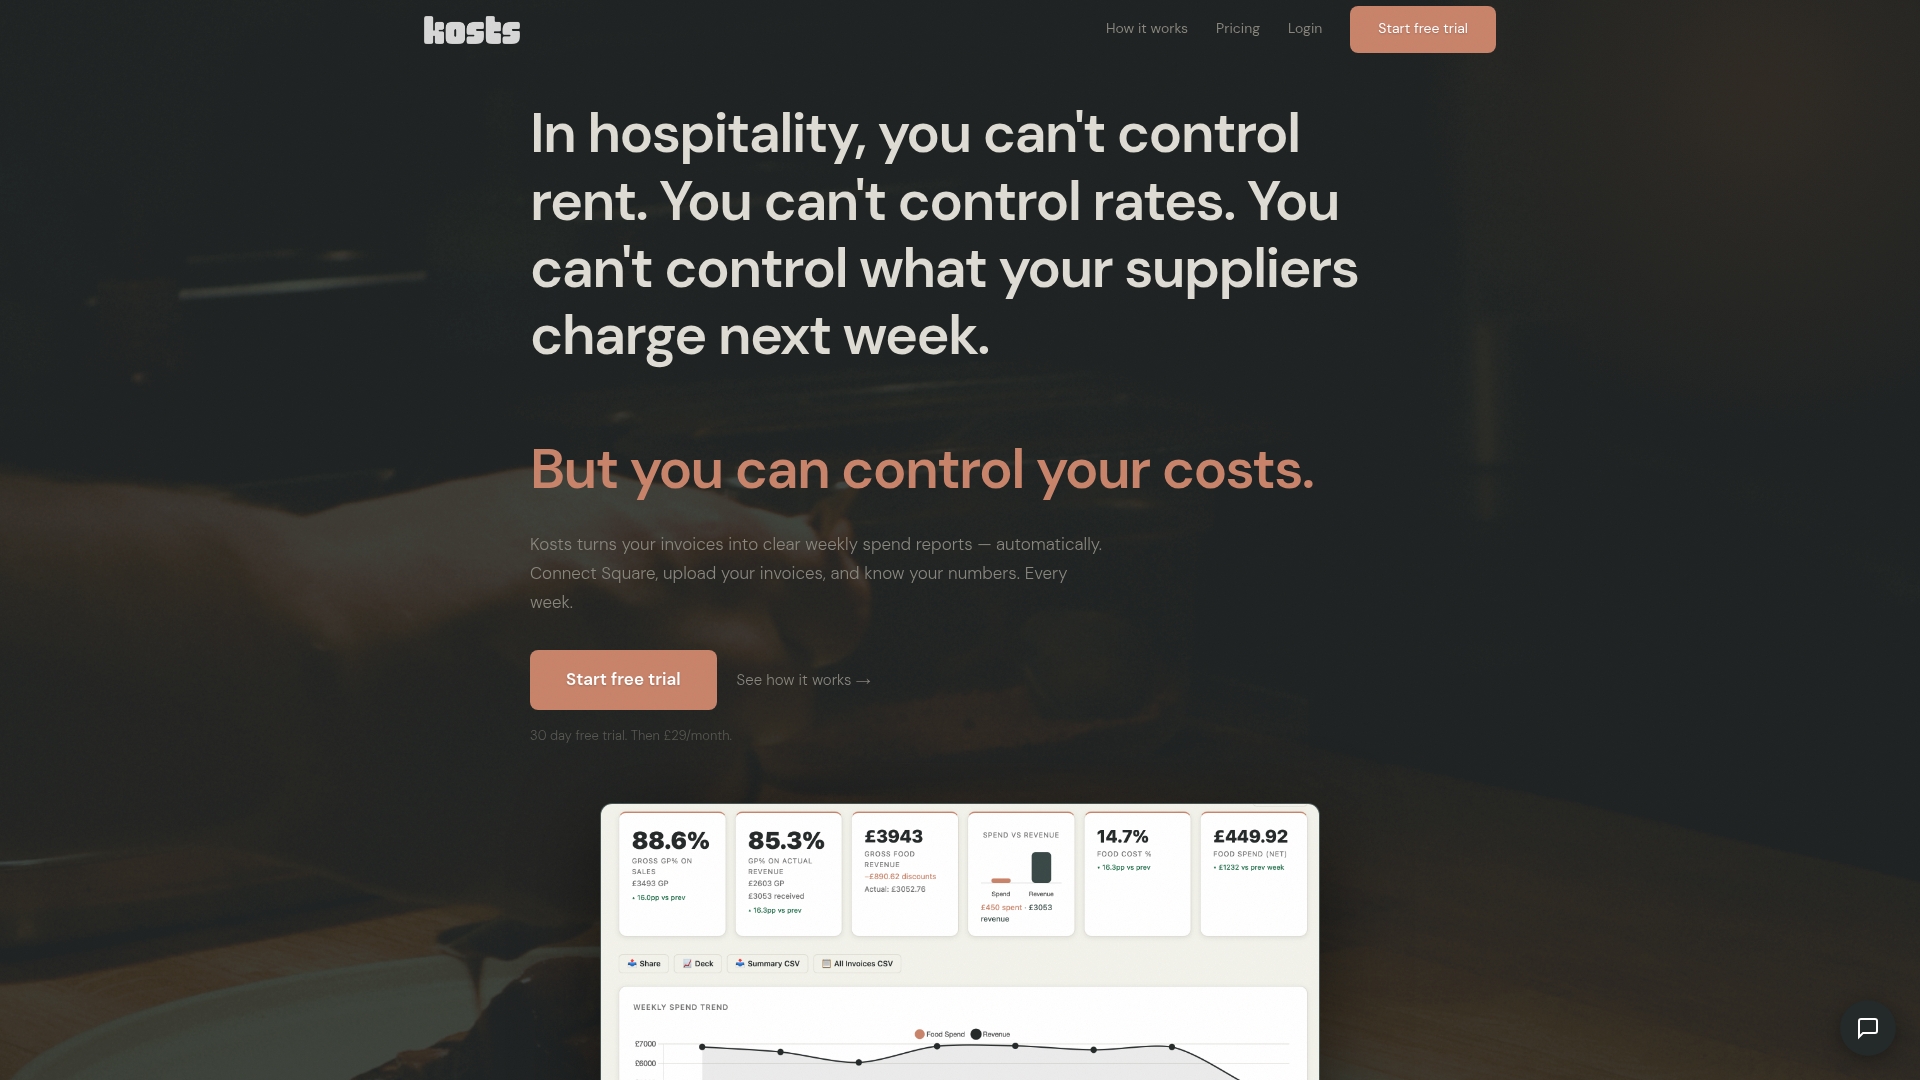
Kosts gives UK independent restaurants automated cost reporting without the complexity of enterprise software. Upload invoices by photo, PDF, or email, and your weekly spend reports build themselves. Connect to Square or Xero for automatic revenue import, and your food cost percentage updates in real time. Whether you want to tackle portion drift, track delivery commissions, or simply stop spending hours on spreadsheets, explore automated expense tracking for UK restaurants and start your 30-day free trial today.
Frequently asked questions
What is the prime cost and why should UK restaurants track it weekly?
Prime cost is the combined total of food and labour expenses, and should sit between 55% and 65% of revenue. Tracking it weekly means problems are caught within days rather than weeks, protecting your margins before losses compound.
How can automated cost reporting software improve restaurant margins?
Automation provides real-time visibility that manual spreadsheets cannot match. Restaurants using these tools save £3,000 to £4,000 per month and reduce food costs by around 5% through faster identification of waste and pricing issues.
Which common mistakes lead to cost report inaccuracies?
Portion drift on proteins, failing to maintain daily waste logs, and not auditing supplier invoices regularly are the most common causes of inaccurate cost reports and hidden financial losses.
What is variance analysis in cost reporting?
Variance analysis compares your actual food cost against your theoretical food cost based on recipes and portion sizes. A difference under 2% indicates strong operational control, while anything higher signals a problem worth investigating immediately.