
Many UK restaurant owners run their businesses on instinct. They know their regulars, they trust their gut on portion sizes, and they price dishes based on feel rather than figures. But instinct alone rarely builds a profitable restaurant. The operators who consistently grow their margins and weather tough trading periods are the ones who treat financial data as a working tool, not an afterthought. This guide walks you through exactly how to collect, interpret and act on the numbers that matter most, so you can make smarter decisions every week.
Table of Contents
- Why financial data matters for restaurant success
- Types of financial data every restaurant should monitor
- How to use financial data for cost optimisation
- Turning financial data into actionable decisions
- From data to profit: real-world restaurant examples
- Take your next step: tech tools for smarter restaurant data
- Frequently asked questions
Key Takeaways
| Point | Details |
|---|---|
| Data drives decisions | Successful UK restaurants use financial data to inform every major choice. |
| Cost control is essential | Tracking expenses and margins ensures long-term profitability and sustainability. |
| Technology boosts accuracy | Automated tools simplify data gathering and unlock smarter actions for owners. |
| Apply insights regularly | Review financial figures weekly and act quickly to adjust menu, staffing or purchasing as needed. |
Why financial data matters for restaurant success
Every decision you make in your restaurant, from ordering stock to scheduling staff, has a financial consequence. Without reliable data, you are essentially guessing. And in an industry where margins are notoriously thin, guessing is expensive.
Financial data gives you a clear picture of where money is coming in and where it is leaking out. It helps you spot trends before they become problems, plan for quieter periods, and negotiate better terms with suppliers. It also keeps you on the right side of HMRC and supports any sustainability commitments your business has made. As noted in hospitality accounting compliance, clear financial records are vital for restaurant longevity and compliance.
Here is a quick summary of the core benefits:
- Cost control: Spot overspending by category or supplier before it compounds
- Forecasting: Use historical revenue data to plan staffing and purchasing
- Debt management: Track cash flow to avoid shortfalls and manage credit responsibly
- Compliance: Maintain accurate records for VAT returns and tax filings
- Growth planning: Identify your most profitable dishes, services and trading periods
"Restaurants that maintain clear, consistent financial records are far better positioned to survive economic pressure and scale sustainably." Solid restaurant budgeting tips start with understanding what you are actually spending.
The shift from gut feeling to data-informed decisions does not require an accountant on staff. It requires the right habits and the right tools.
Types of financial data every restaurant should monitor
Not all numbers carry equal weight. Knowing which data points to focus on saves you time and sharpens your decision-making considerably.
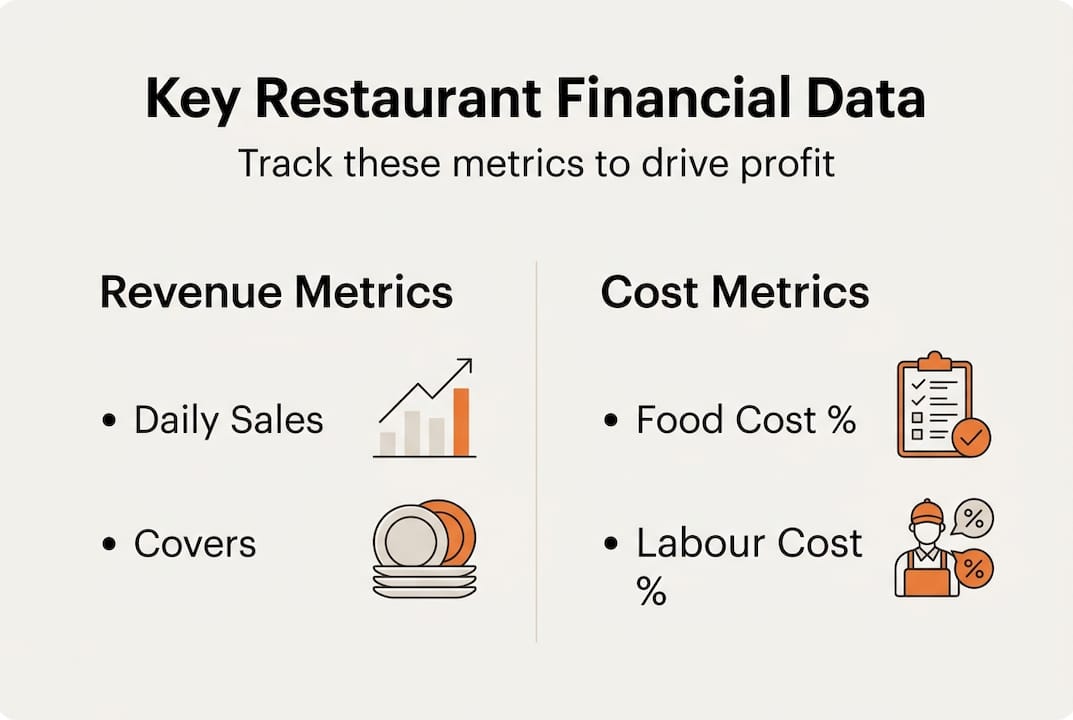
Here are the five core categories every UK restaurant should track:
| Data type | What it measures | Where to find it |
|---|---|---|
| Revenue | Total sales by day, week, or cover | POS system, Square, card terminals |
| Cost of goods sold (COGS) | Ingredient and supply costs | Supplier invoices, stock records |
| Labour costs | Wages, NI contributions, overtime | Payroll software, rota records |
| Overheads | Rent, utilities, insurance, subscriptions | Bank statements, accounting software |
| Cash flow | Money in vs. money out over time | Bank account, Xero or similar |
Each of these data types tells a different story. Revenue tells you how busy you are. COGS tells you how efficiently you are buying and using ingredients. Labour costs reveal whether your rota is aligned with actual demand. As automated expense tracking research confirms, effective expense tracking improves profitability by giving owners a real-time view of where money is going.
Fast ways to gather each data type efficiently:
- Photograph or forward invoices immediately on receipt rather than batching them weekly
- Connect your POS system to your accounting software for automatic revenue import
- Use a weekly spend report checklist to ensure nothing is missed
- Review your expense management tips process monthly to close any gaps
Pro Tip: Track your food cost percentage every single week, not just at month end. A small creep from 28% to 33% over four weeks can wipe out your profit margin entirely before you notice it on a monthly report.
How to use financial data for cost optimisation
Collecting data is only half the job. The real value comes from acting on it. Here is a straightforward process for turning your numbers into cost savings.
- Establish your baseline. Calculate your current food cost percentage, labour cost ratio and gross profit margin. These are your starting benchmarks.
- Identify your biggest cost categories. Sort your expenses by size. Your top three spending areas are where the biggest savings usually hide.
- Compare actuals against targets. Set a target food cost percentage (typically 28 to 35% for UK restaurants) and flag any week where you exceed it.
- Investigate variances. A spike in COGS might mean a supplier price increase, over-ordering, or waste. Dig into the detail before drawing conclusions.
- Make one change at a time. Adjust a supplier, renegotiate a contract, or update a recipe, then measure the impact before making the next change.
- Review and repeat. Cost optimisation is not a one-off project. Build it into your weekly and monthly routine.
When it comes to tracking methods, the difference between manual and automated approaches is significant:
| Approach | Speed | Accuracy | Time investment | Best for |
|---|---|---|---|---|
| Manual (spreadsheets) | Slow | Prone to errors | High | Very small operations |
| Automated (software) | Fast | High | Low | Most independent restaurants |
Automated tools pull invoice data, categorise spending and generate reports without you having to enter figures by hand. This frees up time and reduces the risk of costly mistakes. Reviewing your cost control workflow and using a cost control checklist can help you build this into a reliable system. For practical inspiration, cost control examples from similar UK restaurants show what is achievable.
As food cost analysis research shows, analysing food costs leads directly to better profits when done consistently.
Pro Tip: Review your labour cost trends every month, not just when you feel overstaffed. Patterns often emerge around specific days or shifts where you are paying for hours that do not match your covers. Adjusting just two shifts per week can save thousands over a year.
Turning financial data into actionable decisions
Data without interpretation is just noise. The skill is in reading your numbers correctly and knowing which signals to act on.
Start by looking for trends rather than isolated figures. A single bad week for food costs might be a one-off. Three consecutive weeks of rising COGS is a pattern that demands action. Key performance indicators (KPIs) such as gross profit margin, food cost percentage and revenue per cover give you a consistent framework for comparison week on week.
Common mistakes UK restaurateurs make when interpreting data:
- Focusing only on revenue and ignoring whether that revenue is actually profitable
- Reviewing data too infrequently, meaning problems compound before they are spotted
- Comparing the wrong periods, such as a quiet January against a busy December
- Ignoring small variances, which often signal bigger issues building underneath
- Not linking data to decisions, collecting numbers but never changing behaviour based on them
"Data-driven decisions foster growth and cut waste, giving restaurant operators a genuine competitive edge over those relying on instinct alone."
Once you can read your data confidently, connect it directly to your menu and purchasing decisions. If your food cost tracking tips reveal that a popular dish has a food cost above 40%, it is either priced too low or built with the wrong ingredients. Your data tells you which problem to solve.
From data to profit: real-world restaurant examples
Principles are useful. Examples are better. Here are two scenarios that illustrate how financial data translates into real profit improvements for independent UK restaurants.
Example one: The hidden supplier creep A 40-cover bistro in the Midlands noticed their weekly food cost percentage had risen from 30% to 36% over two months. By reviewing their invoice data by supplier, they identified that one produce supplier had quietly increased prices on six key items. Armed with the data, the owner renegotiated terms and switched two items to an alternative supplier. Food cost percentage returned to 31% within three weeks.
Example two: The overstaffed Sunday A café in South London tracked labour costs by day of the week for the first time. The data showed Sunday labour costs were running at 42% of Sunday revenue, compared to 28% on other days. They reduced Sunday staffing by one person per shift and adjusted opening hours slightly. Monthly labour savings came to just over £600.
Key actions and outcomes from both examples:
- Reviewed financial data by category and time period, not just in totals
- Identified a specific, measurable problem rather than a vague feeling
- Made a targeted change and tracked the result
- Achieved profit improvement without reducing quality or service
As systematic food cost analysis evidence shows, consistent review of food cost data delivers tangible profit improvements for operators who act on what they find. More food cost control examples from UK restaurants confirm this is not the exception. It is the norm for those who commit to the process.
Take your next step: tech tools for smarter restaurant data
Understanding your financial data is one thing. Having a system that makes it easy to collect, organise and act on that data every week is what separates the restaurants that grow from those that struggle. Technology removes the friction from the process, so you spend less time on admin and more time running your restaurant.
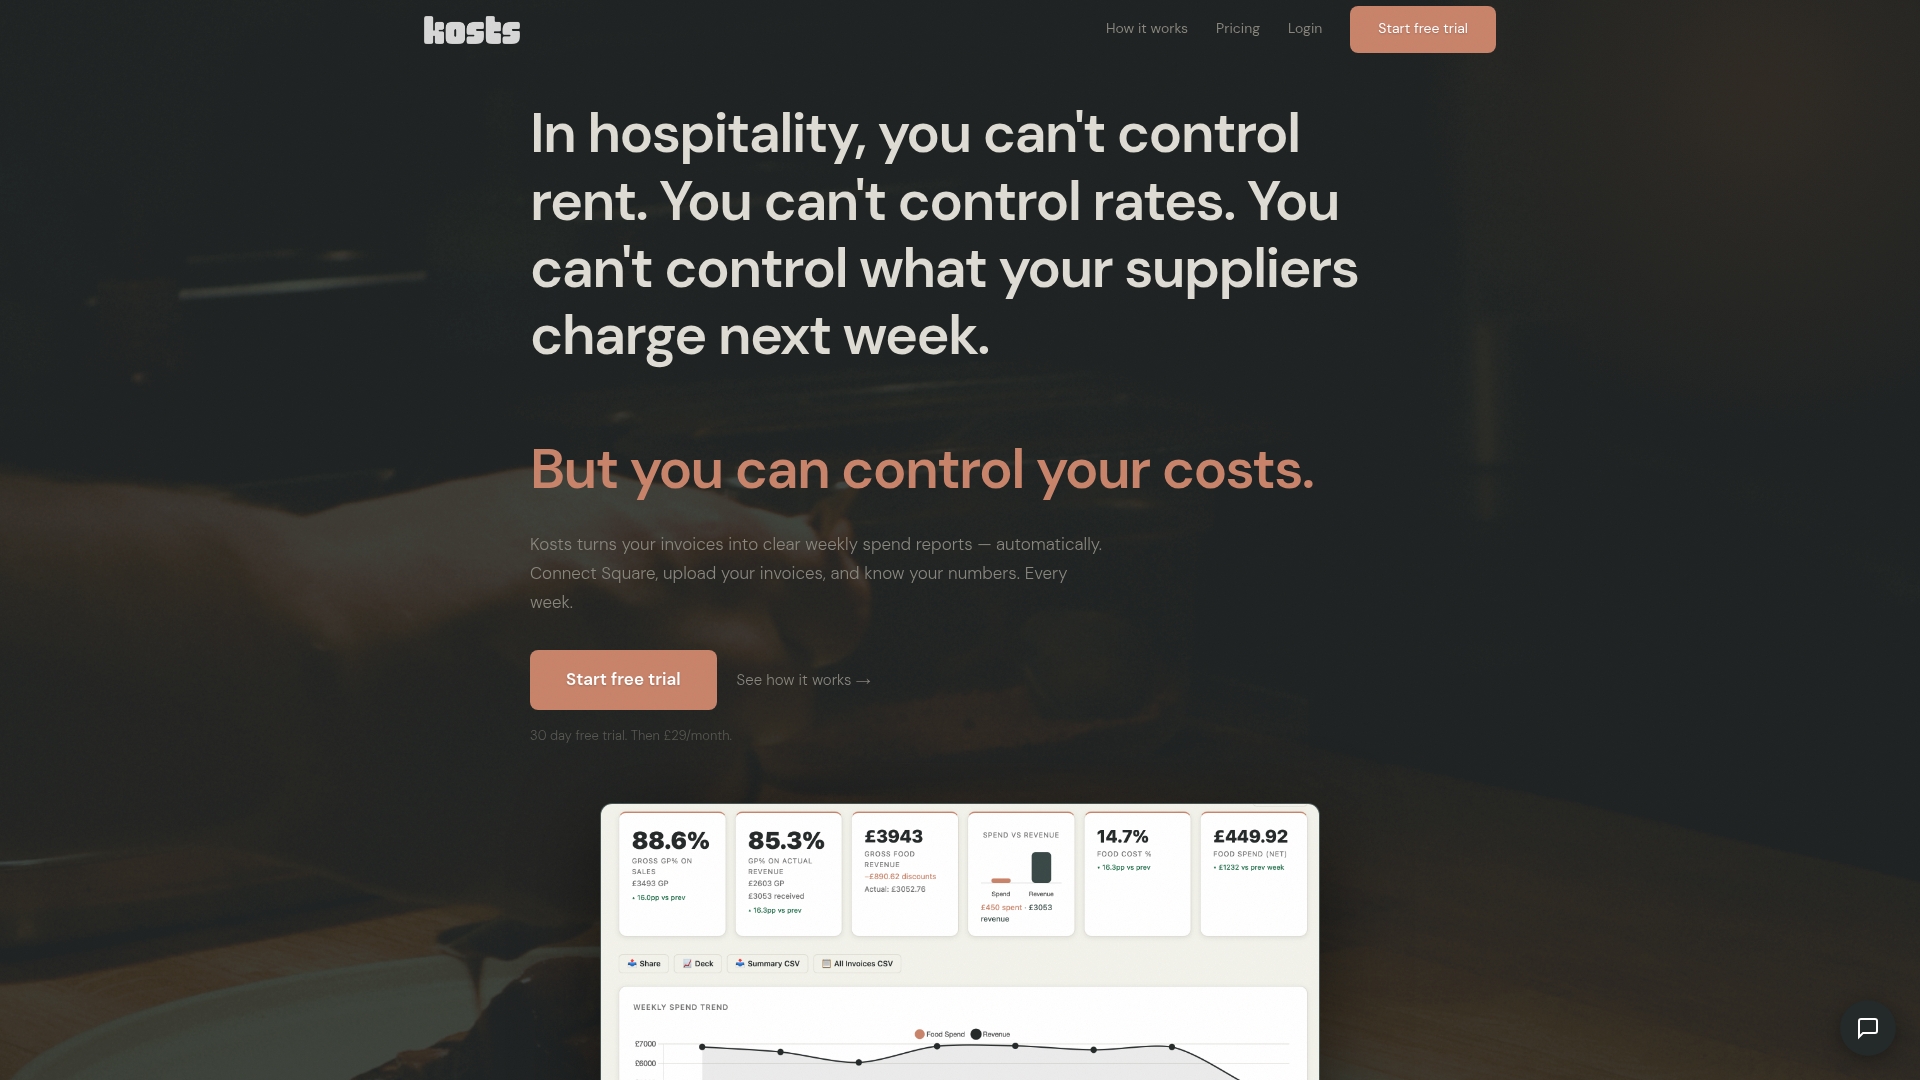
Kosts is built specifically for independent UK restaurants and food service businesses. You can upload invoices by photo, PDF or email, and the platform automatically extracts supplier, item, category and cost data. It connects with Square and Xero for automatic revenue import, and gives you a clear dashboard showing food cost percentage, gross profit and spending breakdowns by week, month or quarter. If you want to track financial data easily without spreadsheets or complex software, Kosts offers a 30-day free trial so you can see the difference it makes before committing to a subscription.
Frequently asked questions
What are the most important financial metrics for a UK restaurant?
Key metrics include food cost percentage, gross profit margin, labour cost ratio and cash flow. Monitoring food and expense metrics consistently is what drives improved profits over time.
How often should restaurant financial data be reviewed?
Review core financial figures weekly and conduct deeper analysis monthly for optimal control. Frequent expense tracking leads to more actionable insights and faster responses to problems.
How can financial data help reduce waste in a restaurant?
Financial data pinpoints exactly where inefficiencies are occurring, so you can make targeted changes rather than guessing. Data-driven decisions reduce unnecessary costs and waste across purchasing, portioning and staffing.
Are manual or automated expense tracking methods better?
Automated systems provide faster, more reliable data and easier analysis for most independent restaurants. Automated expense tracking improves accuracy and efficiency, though manual records can work for very small operations willing to invest the time.