
Managing your restaurant's weekly spend reports shouldn't feel like navigating a maze of invoices and spreadsheets. Yet many independent UK restaurant owners spend hours each week wrestling with financial data, only to discover cost overruns too late to act. The difference between profitable operations and financial strain often comes down to timely, accurate spend reporting. This article provides a practical checklist to transform your weekly reporting from a dreaded chore into a strategic advantage that keeps your costs under control and your margins healthy.
Table of Contents
- Key takeaways
- Criteria for an effective weekly spend report checklist
- Top automation tools to simplify your weekly spend reporting
- Comparing manual processes and automated solutions
- Choosing the right weekly spend reporting approach for your restaurant
- Improve your weekly spend reporting with Kosts
- Frequently asked questions about weekly spend report checklists
Key Takeaways
| Point | Details |
|---|---|
| Weekly data gathering | Collect data from supplier invoices, bank statements and the POS system to avoid blind spots in your weekly report. |
| Clear expense categorisation | Break expenses into food cost, beverage cost, labour and overheads to reveal precise cost drivers. |
| Key weekly metrics | Track cost of goods sold, food cost percentage, labour cost percentage, prime cost and gross profit margin to flag early warning signals. |
| Traffic light system | Create a simple traffic light colour code to spot problems quickly and prioritise investigation. |
Criteria for an effective weekly spend report checklist
Your weekly spend report checklist needs to capture the full picture of your restaurant's financial health without drowning you in unnecessary detail. Start by gathering data from every financial touchpoint: supplier invoices, bank statements, and your POS system. Missing even one source creates blind spots that can hide significant cost issues.
Accurate categorisation separates successful operators from those constantly surprised by their numbers. Break expenses into clear buckets: food cost, beverage cost, labour, and overheads. This restaurant cost analysis guide confirms that weekly spend report checklists for UK independent restaurants should include gathering supplier invoices, categorising expenses, calculating COGS, and reviewing labour costs alongside key performance indicators.
The real power comes from calculating essential metrics weekly. Your checklist must include cost of goods sold, food cost percentage, labour cost percentage, prime cost, and gross profit margin. These aren't just numbers for accountants. They're early warning signals that tell you when something needs attention.
Target ranges matter enormously. Aim for food cost between 28-35%, labour cost between 25-35%, prime cost below 60%, and gross profit margin between 60-70%. When your actual numbers drift outside these ranges, you've identified a problem while there's still time to fix it.
Variance identification completes your checklist. Compare actual spending against your targets and previous weeks. A 2% jump in food cost might not sound dramatic, but over a year it can represent thousands of pounds in lost profit. Catching it in week one means you can streamline your restaurant cost control workflow before the variance compounds.
Pro Tip: Create a simple traffic light system for your weekly report. Green means within target, amber signals approaching limits, and red demands immediate investigation. This visual approach lets you spot problems in seconds rather than minutes of number crunching.
Top automation tools to simplify your weekly spend reporting
Automation transforms weekly spend reporting from a time sink into a strategic advantage. Several platforms now serve UK independent restaurants specifically, each bringing different strengths to the table.
Jelly leads the pack for comprehensive cost management, offering automated invoice processing and real-time cost calculations. Opsyte focuses on procurement and supplier management alongside spend tracking. MarketMan provides inventory management integrated with cost analysis. Ometis hospitality solutions and Flipdish POS reporting features automate invoice processing, calculate real-time COGS, and generate weekly flash reports, potentially saving 10-20 hours weekly whilst improving gross margins.
The shared features across these platforms reveal what matters most. Automated invoice OCR eliminates manual data entry by scanning and extracting information from supplier documents. POS integration pulls sales data automatically, ensuring your revenue figures stay current without additional work. Real-time cost calculations update your key metrics as transactions occur rather than waiting for weekly manual updates.
The time savings prove substantial. Restaurant operators report reclaiming 10-20 hours weekly previously spent on manual data entry and spreadsheet updates. Accuracy improves dramatically when human error gets removed from routine data transfer. Quick reporting means you see problems on Monday rather than discovering them the following month.
Real impact shows in the numbers. Jelly users typically report gross margin improvements of 2% within three months of implementation. That might represent an additional £10,000 to £20,000 annually for a restaurant with £500,000 in revenue.
Integration capabilities determine how well these tools fit your existing systems. Most connect seamlessly with Xero, the accounting software favoured by UK small businesses. Square and Lightspeed POS systems integrate directly, creating a complete restaurant cost control workflow guide without gaps or manual bridges between platforms.
Comparing manual processes and automated solutions
The contrast between manual and automated weekly spend reporting reveals why so many restaurants struggle with cost control. Manual methods typically involve downloading data from multiple sources, copying figures into spreadsheets, and calculating metrics by hand or with formulas. This approach remains common because it requires no additional investment beyond time.
Spreadsheets carry inherent risks. A single misplaced decimal point or incorrect formula can cascade through your entire report, producing misleading conclusions. Manual data entry introduces errors at rates between 1-4%, meaning every 25th to 100th figure might be wrong. These mistakes often go undetected until they've caused significant financial damage.
Timing poses another critical difference. Manual processes usually run monthly because weekly updates demand too much time. But hospitality financial accounting guides confirm that manual spreadsheets prove error-prone and delayed, whilst automation reduces admin by 90% and enables timely weekly interventions before variances escalate into serious problems.
Automation delivers real-time data that updates continuously as transactions occur. You see today's food cost percentage based on this morning's deliveries and last night's sales. This immediacy enables early detection of variances when they're still small and manageable.
The time investment comparison tells a compelling story:
| Aspect | Manual Process | Automated Solution |
|---|---|---|
| Weekly time required | 8-12 hours | 30-60 minutes |
| Error rate | 1-4% of entries | Less than 0.1% |
| Data freshness | Days to weeks old | Real-time |
| Variance detection | Monthly | Daily or weekly |
| Staff training needed | Moderate spreadsheet skills | Minimal, intuitive interface |
Administrative burden drops by roughly 90% with automation, freeing managers to focus on improving operations rather than compiling reports. The speed advantage means you can respond to cost issues within days rather than discovering them weeks later when the damage is done.
Pro Tip: Even with automation, maintain regular training sessions for your team on cost awareness. Technology provides the data, but your staff's understanding and buy-in determine whether that data translates into behavioural changes that actually control costs.
"For independent restaurants, automated weekly reporting isn't a luxury anymore. It's the difference between managing costs proactively and constantly fighting fires. The operators who embrace these tools consistently outperform those stuck with monthly spreadsheets." – Financial controller, UK hospitality group
The combination of automation and engaged staff creates a powerful cost control culture. Your restaurant financial workflow guide becomes a living tool rather than a monthly ritual everyone dreads.
Choosing the right weekly spend reporting approach for your restaurant
Selecting the optimal reporting method starts with honest assessment of your current situation. Consider your restaurant's size, available budget, and technical readiness before committing to any approach. A 20-seat neighbourhood bistro has different needs than a 100-cover restaurant with multiple revenue streams.
Budget constraints matter, but so does the cost of inaction. Calculate what poor cost control currently costs you. If delayed reporting means you discover a 3% food cost overrun after two months, that might represent £5,000 in lost profit for a restaurant with £100,000 monthly revenue. Suddenly a £200 monthly software subscription looks like excellent value.
Technical readiness extends beyond just having computers. Does your team already use POS systems comfortably? Do you have reliable internet connectivity? Are your suppliers able to send digital invoices? These factors influence which solutions will work smoothly versus creating new frustrations.
Restaurant financial reporting advice emphasises that independent restaurant owners should prioritise tools integrating POS systems like Square and Lightspeed with accounting systems such as Xero, plus automated invoice OCR for weekly insights without needing a dedicated data team.
Integrated systems deliver the best results because they eliminate gaps where data gets lost or requires manual transfer. Your ideal setup connects your POS, accounting software, and invoice processing into one seamless flow. This integration means entering data once and having it flow automatically through all your reporting.
Follow this implementation checklist to ensure smooth adoption:
- Audit your current data sources and identify which systems need to connect for complete weekly reporting
- Evaluate three to five potential solutions against your specific requirements, focusing on UK-focused platforms with proven hospitality experience
- Request demonstrations and trial periods to test the interface with your actual team members who will use the system daily
- Start with a pilot period tracking one or two key metrics before rolling out comprehensive reporting across all cost categories
- Schedule weekly review sessions for the first month to identify any data gaps or process adjustments needed
- Train all relevant staff on interpreting the reports and understanding how their actions influence the numbers
- Establish clear accountability for weekly report review and action items based on identified variances
Timing proves crucial for effective cost control. Monthly reports arrive too late for meaningful intervention. By the time you spot a problem in a monthly report, you've already absorbed four weeks of unnecessary costs. Weekly monitoring catches issues whilst they're still manageable and correctable.
The benefits compound over time. Initial setup requires effort, but within weeks you'll wonder how you ever managed without timely, accurate data. Your decision making improves when based on current information rather than outdated hunches. Staff accountability increases when everyone knows the numbers get reviewed weekly. Supplier negotiations become easier when you have detailed spending data at your fingertips.
Remember that perfect shouldn't be the enemy of good. Start with the most critical metrics for your restaurant, even if you can't track everything immediately. A basic weekly report covering food cost and labour cost provides enormous value compared to monthly-only reporting. You can always expand your tracking as systems and habits mature.
Improve your weekly spend reporting with Kosts
Managing weekly spend reports doesn't have to consume your valuable time or require a finance degree. Kosts automates the entire process, from invoice scanning to KPI calculation, specifically for UK independent restaurants like yours.
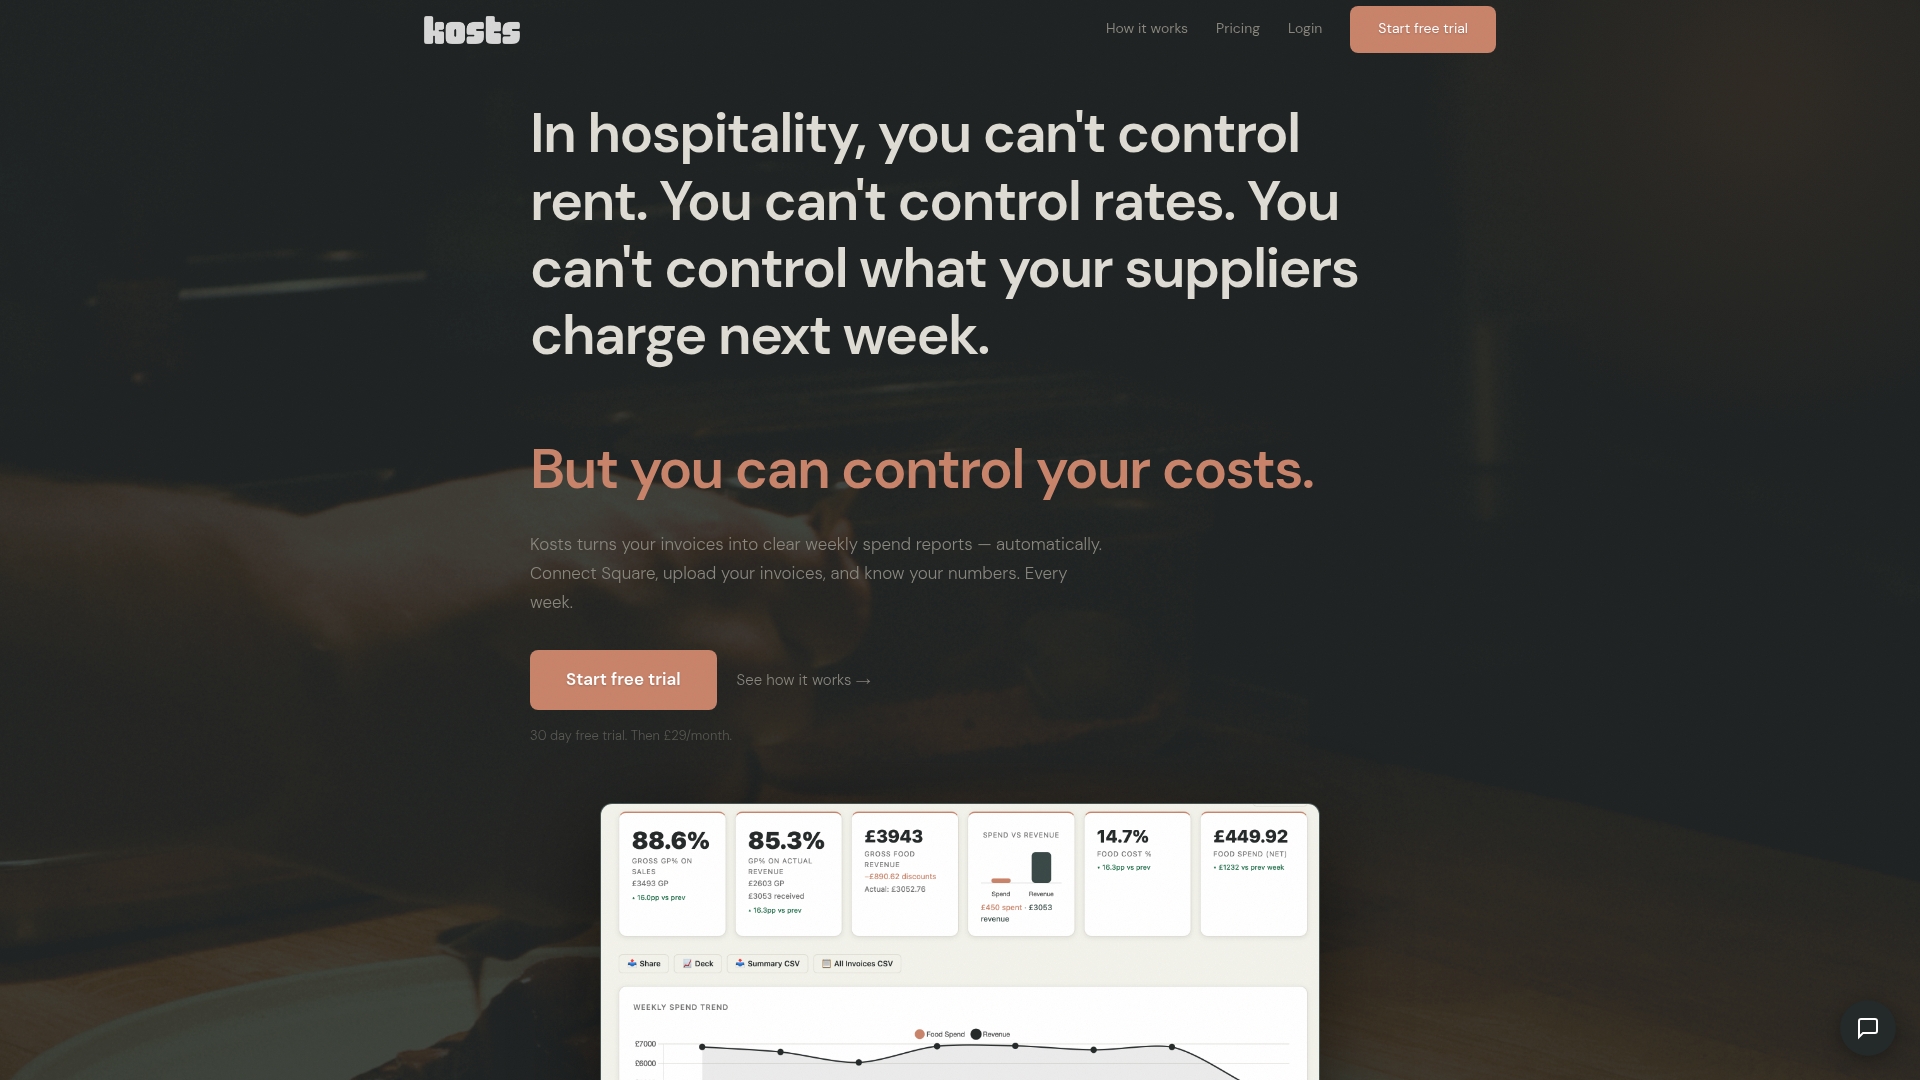
The platform handles data collection automatically by scanning invoices you photograph or email, extracting supplier details, items, and costs without manual entry. Expense categorisation happens instantly, sorting your spending into meaningful buckets that reveal exactly where your money goes each week. Integration with Square, Xero, and other popular systems means your revenue and accounting data synchronises automatically.
Restaurant operators using Kosts reclaim up to 20 hours weekly previously spent wrestling with spreadsheets and manual calculations. That's time you can invest in improving service, developing your menu, or simply achieving better work-life balance. The platform was built by a working chef who understands exactly what restaurant operators need without the complexity of enterprise software designed for corporate chains.
Explore how Kosts can transform your cost control workflow guide from a dreaded weekly chore into a strategic advantage that keeps your restaurant profitable and growing.
Frequently asked questions about weekly spend report checklists
What expenses should be included in a weekly spend report checklist?
Your weekly spend report must capture all operating costs: food purchases, beverage inventory, labour costs including wages and employer contributions, utilities, rent, supplies, and any variable expenses like marketing or equipment repairs. Tracking everything weekly prevents surprises and ensures no cost category escapes attention until it becomes a major problem.
How can automation improve accuracy in weekly spend reports?
Automation eliminates manual data entry errors that plague spreadsheets, reducing mistake rates from 1-4% down to less than 0.1%. Automated systems also ensure consistency in how expenses get categorised and calculated, removing the variability that occurs when different people handle the same task differently. Real-time updates mean your numbers always reflect the latest transactions rather than becoming outdated between manual update sessions.
What key performance indicators are most important to track weekly?
Prioritise food cost percentage, labour cost percentage, prime cost, and gross profit margin as your core weekly KPIs. Food cost percentage reveals whether your purchasing and portioning stay on target. Labour cost percentage shows if scheduling matches actual business levels. Prime cost combines food and labour, your two largest expenses, and should stay below 60%. Gross profit margin indicates overall financial health and typically ranges between 60-70% for successful restaurants.
How often should I review my weekly spend report for cost control?
Review your weekly spend report every Monday morning without exception, examining the previous week's performance whilst details remain fresh. This consistent timing creates accountability and ensures problems get caught within days rather than weeks. Schedule 30 minutes for this review, focusing on variances from targets and previous weeks. Immediate weekly review enables quick corrections before small issues compound into significant financial damage.
Can small restaurants benefit from automation tools or is manual enough?
Small restaurants often benefit most from automation because owner-operators wear multiple hats and can't afford to spend 10 hours weekly on manual reporting. The time savings and accuracy improvements matter even more when you're the chef, manager, and financial controller simultaneously. Modern automation tools offer affordable pricing scaled for independent restaurants, often costing less than the value of time they save. Starting with basic automation for invoice processing and cost calculations provides immediate returns regardless of restaurant size.