TL;DR:
- Spend analysis reveals where restaurant costs are actually coming from, not just what is spent.
- Regular, weekly spend review helps control food, labor, and overhead costs to stay within industry benchmarks.
- Automated tools save time and improve accuracy, enabling small teams to make strategic cost decisions.
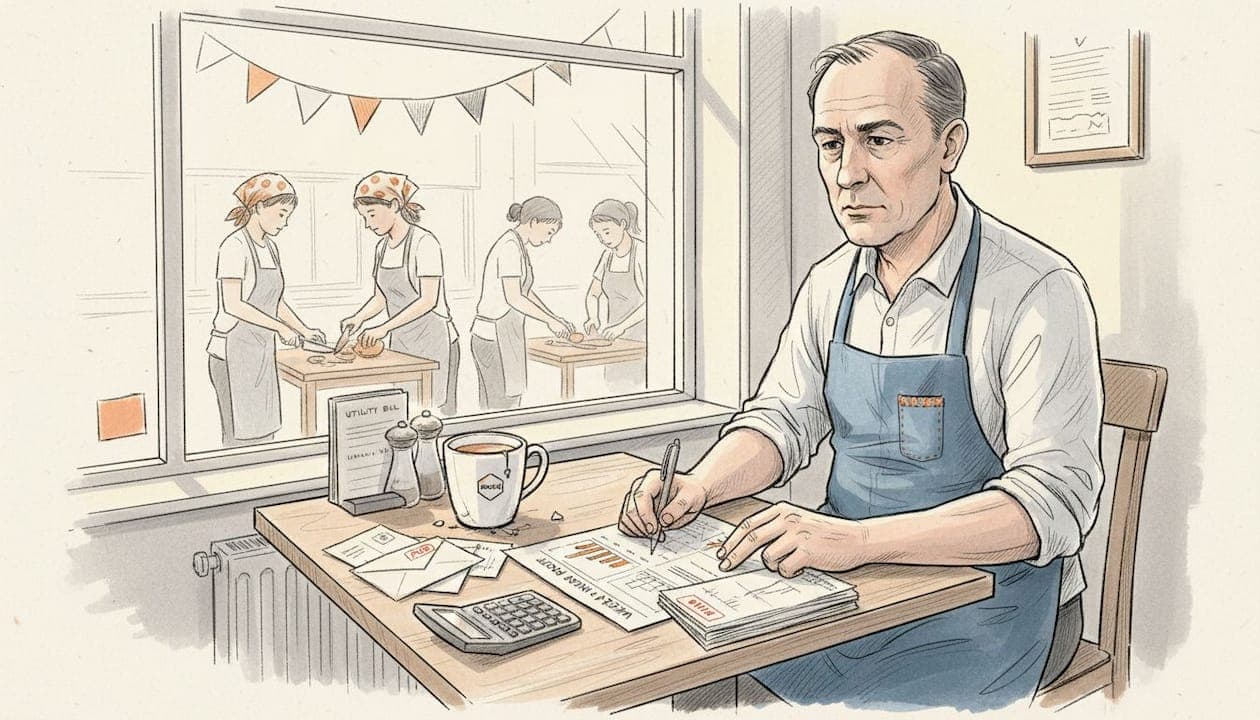
Most independent restaurant owners believe cost control is simply about spending less. Cut the meat order, trim the staff hours, switch to cheaper produce. But that approach misses the point entirely. Real financial control comes from understanding precisely where every pound goes, and that is exactly what spend analysis delivers. With operating costs at 55.2% of turnover for UK hospitality businesses, the difference between a thriving restaurant and a struggling one often lies not in sales volume, but in how clearly you can see and act on your spending patterns.
Table of Contents
- Understanding spend analysis for UK restaurants
- How spend analysis works: steps and frameworks
- Comparing spend analysis tools: manual vs automated approaches
- Turning spend analysis into profit: decision-making and action
- Our take: why spend analysis is the restaurant's secret weapon
- Next steps: bring spend analysis into your restaurant
- Frequently asked questions
Key Takeaways
| Point | Details |
|---|---|
| Spend analysis defined | Spend analysis reveals where your money goes and highlights ways to control costs. |
| Industry benchmarks matter | Comparing your costs to UK benchmarks helps you spot problems and set targets. |
| Manual vs automated | Digital tools make spend analysis easier and more accurate than manual tracking. |
| Turn data into action | Profitable restaurants use spend insights to make better menu, supplier, and staffing decisions. |
Understanding spend analysis for UK restaurants
Spend analysis is the process of collecting, categorising, and examining all your restaurant's expenditure to reveal patterns, inefficiencies, and opportunities. It goes well beyond simply logging expenses in a spreadsheet. Where basic expense tracking tells you what you spent, spend analysis tells you why, whether it was justified, and what you should do differently.
For an independent UK restaurant, spending typically falls into three major categories:
- Food and beverage (COGS): The cost of ingredients and drinks served to customers
- Labour: Wages, National Insurance contributions, and any agency staff costs
- Overheads: Rent, utilities, insurance, software subscriptions, and marketing
Understanding the proportion each category takes from your revenue is where the real insight begins. Industry benchmarks give you a target to aim for. For example, food costs of 28-32% of food sales is considered healthy for most UK restaurants, with labour sitting between 25% and 35% of revenue depending on your service model.
Statistic to note: UK hospitality operating costs average 55.2% of turnover. If your combined food, labour, and overhead costs exceed this figure consistently, spend analysis will show you exactly where the overspend is hiding.
The distinction between expense tracking and spend analysis is important. Tracking is passive. You record a bill and move on. Analysis is active. You compare this week's vegetable spend against last week, ask why it rose by 12%, and trace it back to a supplier price increase or a portion control issue in the kitchen. You can find practical cost control examples that show how this plays out in real restaurant settings.
Without this level of scrutiny, overspending becomes invisible. A restaurant turning over £20,000 per week with food costs running at 36% instead of 30% is losing £1,200 every single week. That is over £60,000 per year, quietly draining away.
How spend analysis works: steps and frameworks
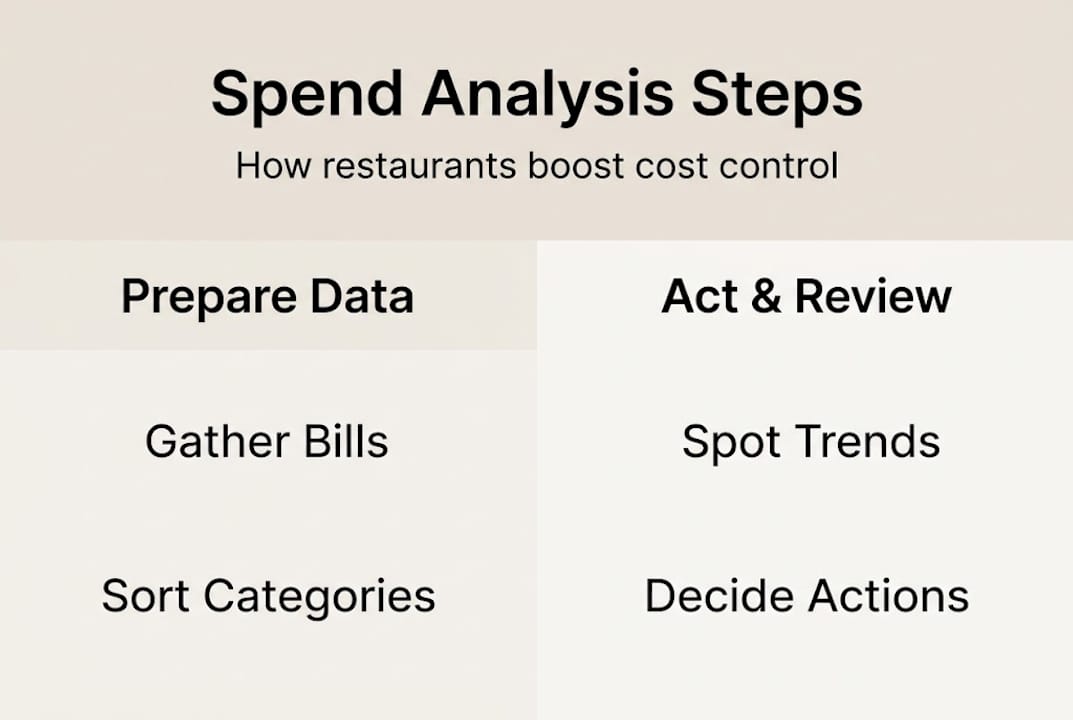
Spend analysis sounds complex, but the process follows a logical sequence that any owner or manager can apply consistently.
- Gather your data. Collect all invoices, payroll records, and supplier statements for the period you are reviewing. Weekly analysis tends to be most actionable for restaurants.
- Categorise every line item. Assign each cost to a category: food, beverage, labour, utilities, and so on. Be consistent with your categories every week.
- Calculate your percentages. Divide each category's total by your revenue for the same period. This converts raw numbers into comparable ratios.
- Benchmark against targets. Compare your percentages to industry benchmarks and your own historical data. Note anything that sits outside your expected range.
- Identify trends and anomalies. Is your dairy spend creeping up month on month? Did labour spike on a particular week? These are the signals worth investigating.
- Take action. Every analysis session should end with at least one decision: renegotiate a supplier contract, adjust a menu price, or revise the rota.
Here is a simple framework to structure your weekly review:
| Category | Target % of revenue | This week's % | Variance | Action required |
|---|---|---|---|---|
| Food and beverage | 28-32% | 34% | +2% | Review portion sizes and wastage |
| Labour | 25-35% | 33% | Within range | Monitor |
| Overheads | 10-15% | 11% | Within range | No action |
A useful spend report checklist can help you build this habit into your weekly routine without it feeling like a chore. Gross profit margins for UK independent restaurants are typically 60-70%, so tracking your spend weekly keeps you inside that window rather than discovering a problem at month end.
Pro Tip: Set a fixed 30-minute slot each Monday morning to review the previous week's spend. Consistency matters far more than perfection. A rough weekly review beats a thorough monthly one every time. For a broader view, explore guidance on optimising operating costs to see how weekly habits compound into significant annual savings.
Comparing spend analysis tools: manual vs automated approaches
Choosing how to conduct your spend analysis matters almost as much as doing it at all. The two main approaches each have genuine strengths.
Manual analysis typically means spreadsheets, paper invoices, and a lot of data entry. Many experienced owners swear by it because it forces close engagement with every number. The downside is time. Manually entering, categorising, and cross-referencing invoices for a busy week can take three to five hours, time most operators simply do not have.
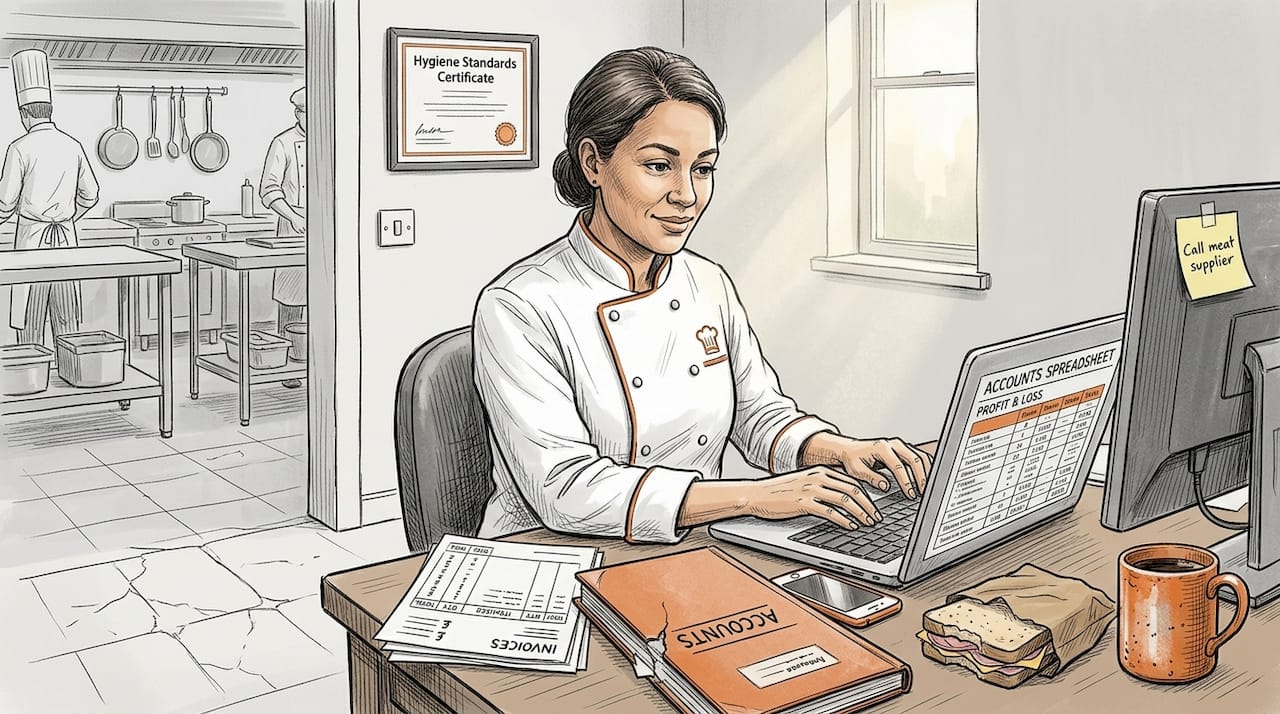
Automated analysis uses cloud-based platforms that scan invoices, extract data automatically, and generate reports without manual input. UK restaurants are increasingly turning to these tools to spot cost trends faster and reduce the administrative burden on small teams.
Here is how the two approaches compare:
| Factor | Manual (spreadsheets) | Automated (digital tools) |
|---|---|---|
| Time required | 3-5 hours per week | 20-30 minutes per week |
| Accuracy | Prone to data entry errors | High, AI-driven extraction |
| Cost | Low upfront, high in labour | Subscription cost, low labour |
| Depth of insight | Limited to what you build | Automatic trend detection |
| Scalability | Difficult as volume grows | Scales easily |
The benefits of automation are particularly strong for small teams. When your head chef is also doing the ordering and your front-of-house manager is handling rotas, nobody has three spare hours on a Monday morning. Smart expense tracking tools eliminate the manual bottleneck and make consistent analysis genuinely achievable.
That said, automation does not replace judgement. A platform can flag that your fish spend rose 18% this week, but only you know whether that reflects a planned special, a delivery error, or a supplier price hike. Read more on why chefs and spend tracking work so well together when the right tools are in place.
Pro Tip: Use automated tools to capture and categorise data, then apply your own operational knowledge to interpret the results. The combination of machine speed and human context is far more powerful than either alone.
Turning spend analysis into profit: decision-making and action
Data without action is just paperwork. The real value of spend analysis lies in the decisions it enables. Once you can see exactly where your money is going, three areas offer the clearest opportunities for improvement.
Supplier decisions. When your analysis reveals that a particular supplier's prices have crept up over three months, you have the evidence to renegotiate or switch. Tracking supplier spend over time gives you a negotiating position that gut feeling never can.
Menu engineering. If your spend data shows that a popular dish has a food cost running at 40%, it either needs a price increase or a recipe adjustment. Spend analysis makes these conversations with your kitchen team factual rather than emotional.
Staffing and rota decisions. Labour is often the largest controllable cost. Comparing labour spend against covers served each day reveals whether you are overstaffed on quiet Tuesdays or understaffed on busy Fridays.
Common quick wins that restaurants identify through regular spend analysis include:
- Eliminating duplicate supplier invoices that go unnoticed in manual systems
- Spotting seasonal ingredient cost spikes before they erode margins
- Identifying low-margin menu items that are driving up COGS without contributing to profit
- Reducing wastage by correlating purchase volumes with actual sales data
- Renegotiating delivery charges with suppliers once spend volume is visible
For pubs and casual dining operators, food cost benchmarks of 25-30% are the standard target, and spend analysis is the primary mechanism for staying within that range. A thorough food cost control checklist can help you translate your analysis findings into a structured action plan.
"The restaurants that consistently hit their margin targets are not necessarily the ones with the highest turnover. They are the ones that review their numbers every week and act on what they find."
Our take: why spend analysis is the restaurant's secret weapon
Here is something most financial advice for restaurants gets wrong: it treats spend analysis as an accounting task rather than a strategic one. The obsession with cutting costs or chasing discounts from suppliers misses the deeper point. Spend analysis is not about spending less. It is about spending intentionally.
We have seen restaurants increase their revenue by 15% and still watch their profit shrink, because the underlying cost structure was never examined. Sales growth without spend visibility is like filling a leaking bucket. You pour more in, but the level never rises.
The restaurants that genuinely thrive are the ones where the owner or manager looks at a weekly spend report and asks: does this reflect the decisions I made this week? That level of ownership over your numbers changes everything. It shifts the conversation from reactive panic at month end to confident, weekly course corrections.
Spend analysis is also where you find the leaks that no amount of extra covers can fix. A 2% reduction in food cost on a £15,000 weekly food spend is £300 per week saved, or £15,600 per year added back to your bottom line. That is the equivalent of a very busy Saturday night, every single week, for free. Learning to master expense management is not a finance skill. It is a survival skill for independent operators in 2026.
Next steps: bring spend analysis into your restaurant
If you have been relying on monthly accountant reports or end-of-week gut checks, there is a better way. Kosts was built specifically for independent UK restaurants by someone who has worked the pass and knows what operators actually need.
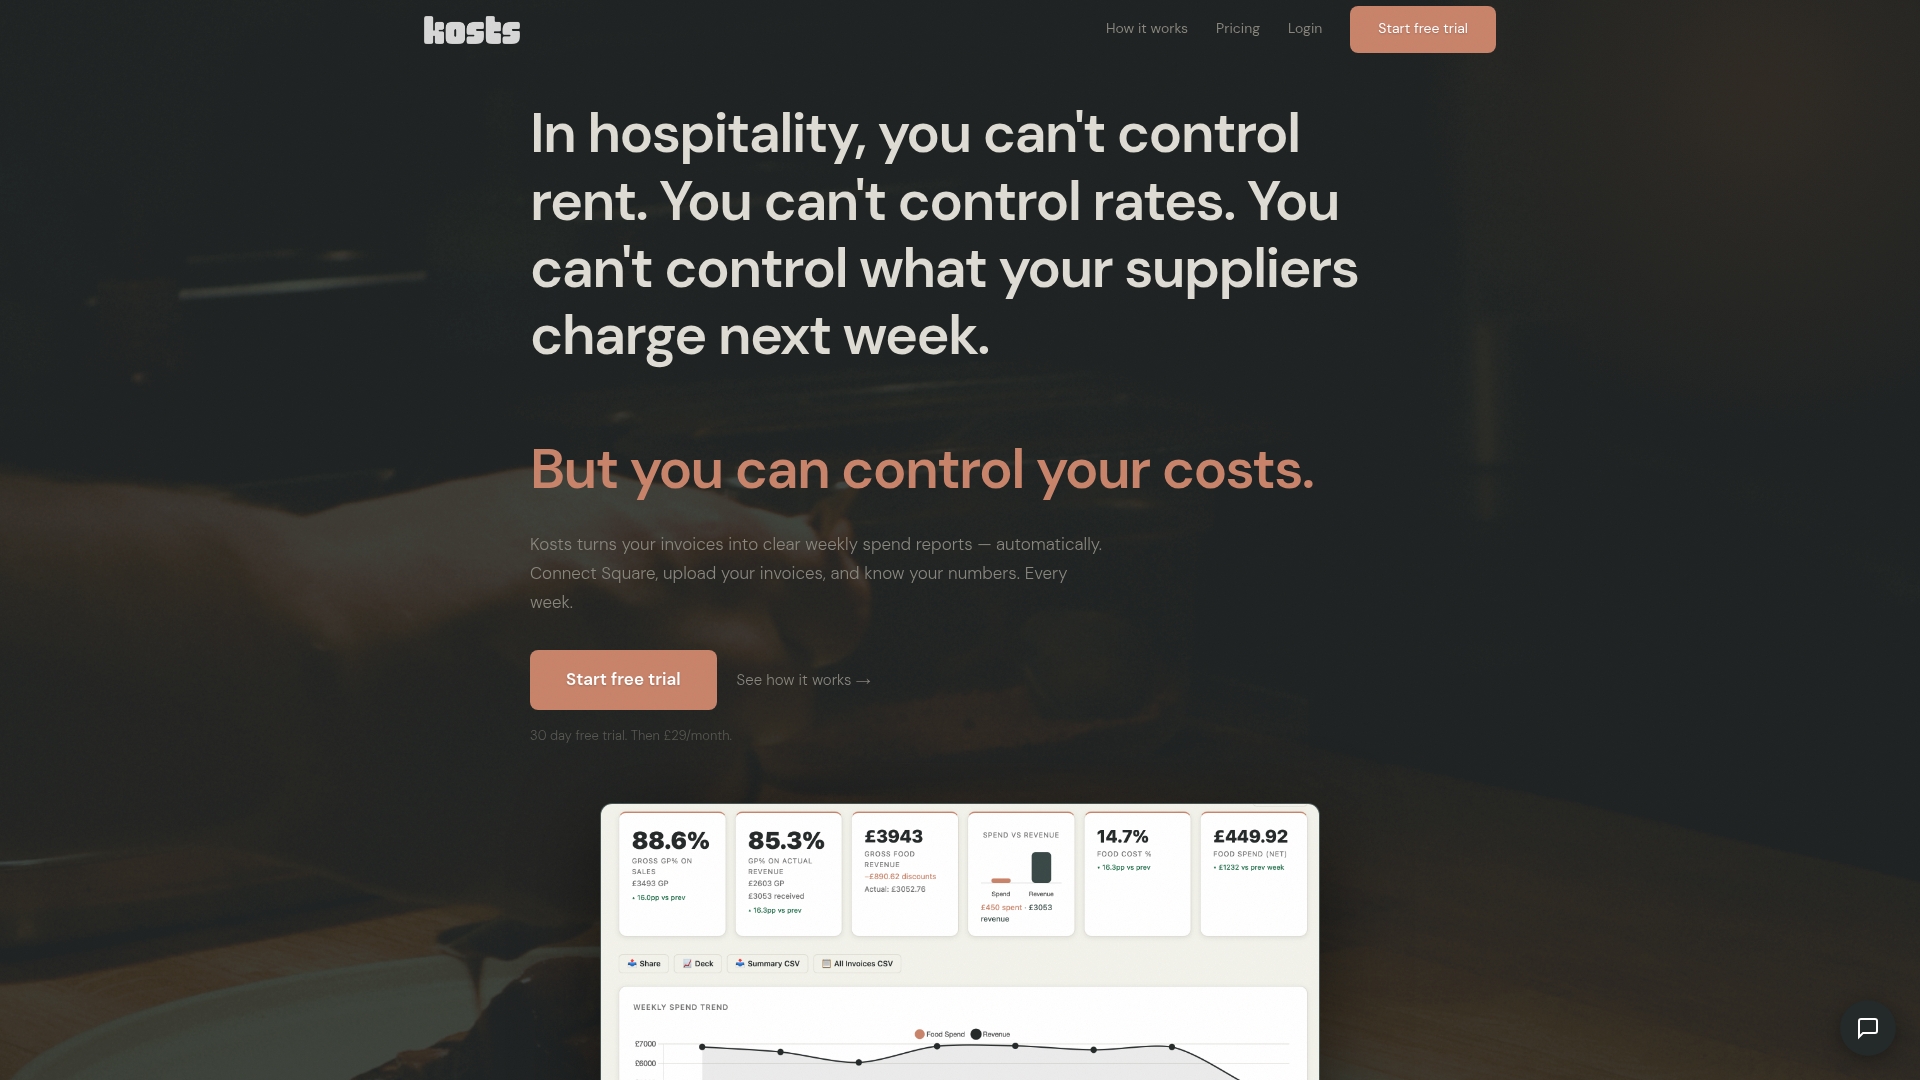
With Kosts, you can automate your spend analysis by uploading invoices via photo, PDF, or email forward. The platform extracts supplier, item, category, and cost data automatically, then generates clear weekly spend reports without any manual data entry. It integrates with Square and Xero for seamless revenue tracking, and you can streamline cost control from day one with a 30-day free trial. No complex setup. No enterprise pricing. Just clear, actionable numbers every week.
Frequently asked questions
What is spend analysis in a restaurant?
Spend analysis in a restaurant means carefully reviewing and categorising all expenditure to understand where money goes and how to optimise costs. For UK independents, it focuses on food, beverage, and labour as the primary cost categories.
How does spend analysis improve profit for UK restaurants?
Regular spend analysis reveals cost-saving opportunities and enables strategic menu and supplier decisions that protect margins. With operating costs at 55.2% of turnover on average, even small percentage reductions translate to significant annual savings.
What are typical spending benchmarks for UK independent restaurants?
Food and beverage costs should sit at 28-35% of revenue, labour between 25-35%, and total operating costs around 55% of turnover. Tracking against these benchmarks weekly keeps your margins on target.
Do small or independent restaurants need automated spend analysis tools?
Automated tools save significant time and surface trends that manual methods often miss, making them especially valuable for small teams. UK restaurants increasingly use digital platforms to make consistent spend analysis achievable without dedicated finance staff.